Boosting GTSpotter with preview capabilities
GTSpotter is a novel search interface for spotting objects that we introduced a short while ago. It is part of the Glamorous Toolkit and it is now also available by default in the latest Pharo 4.0.
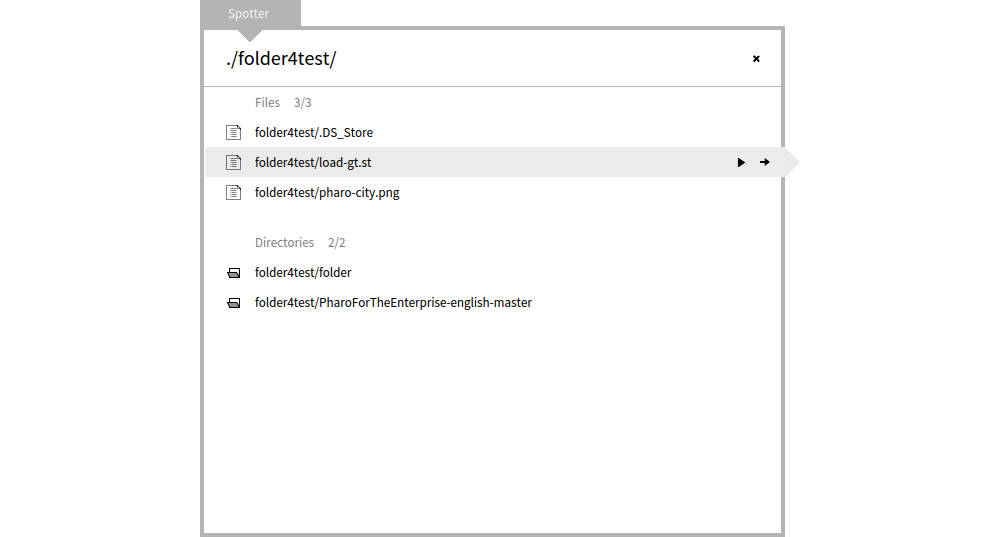
You trigger it with Shift+Enter and you search. For example, GTSpotter allows you to search through the file system. It looks like this:
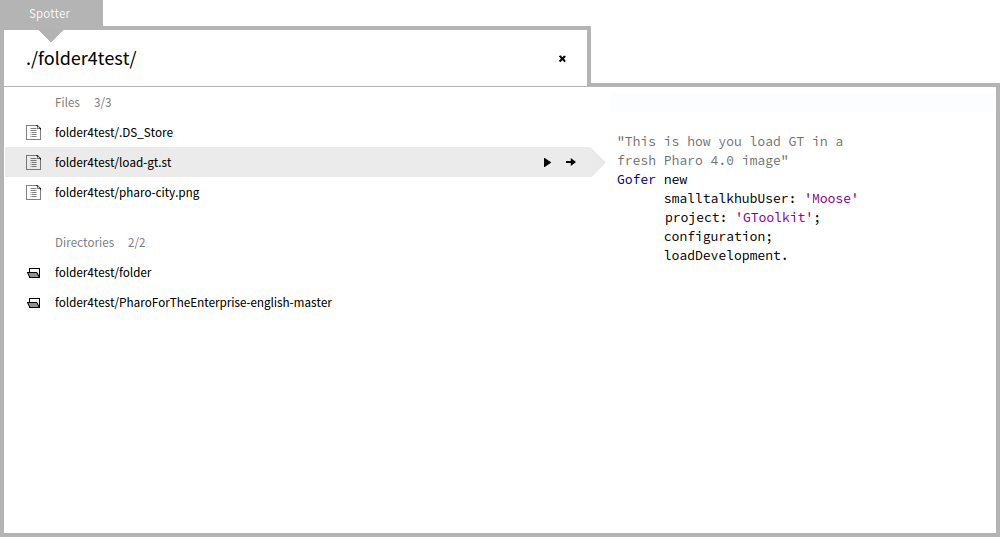
Pressing Enter inspects the file. However, before pressing Enter it would be mighty useful to take a peak into that file, would it not? To this end, we introduced the Preview capability. Pressing Cmd+P toggles the preview. As we are looking at an st file, we even get code highlighting.
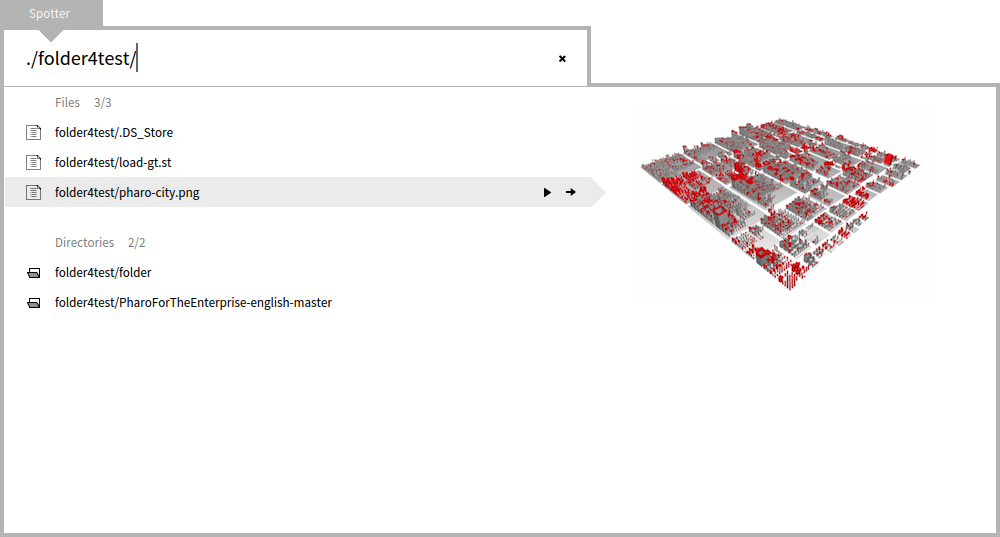
The preview of a picture file shows the picture.
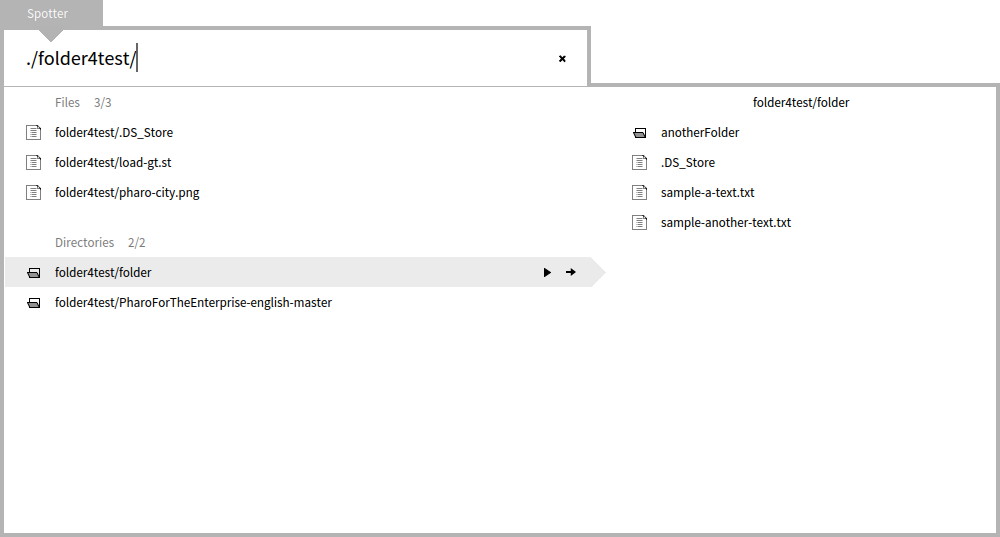
And for a folder it shows its contents.
Obviously, these previews are not hardcoded in a central place. Instead, like in the case of the GTInspector, each object can decide how to be previewed. By default, the preview consists of the basic object structure.
By adding dedicated extension methods in desired classes allows you to customize the preview. For example, the below code shows how the source code preview of a CompiledMethod is being defined:
CompiledMethod>>spotterPreviewCodeIn: aComposite
     <spotterPreview: 10>
     aComposite pharoMethod
          title: [ self gtDisplayString ];
          display: [:compiledMethod |
               ' ', compiledMethod getSource];
          smalltalkClass: #methodClass;
          entity: self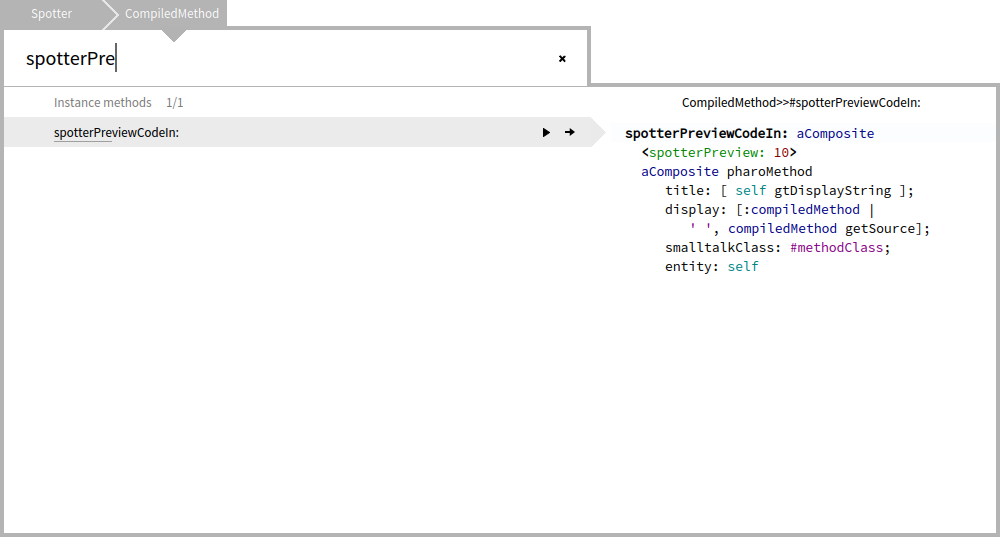
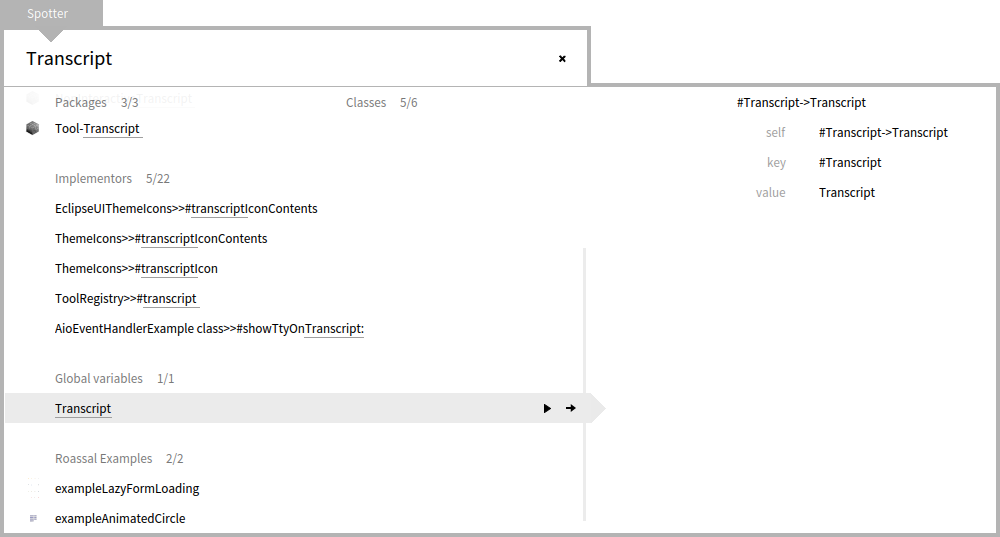
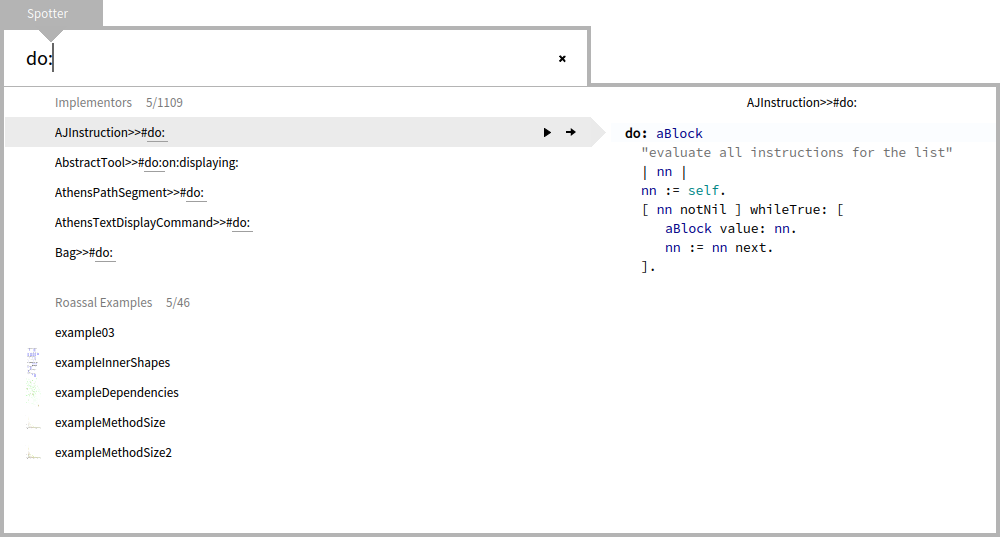
Combining the preview ability with the diving option described in the previous post, opens new possibilities for GTSpotter. For example, besides fast file browsing, GTSpotter now also can replace the myriads of windows produced by Implementors/Senders/References. For example, in the picture below, searching for do: provides the list of implementors, and diving into a method shows more implementors and senders.
Let’s take another example: an often occurring need consists in finding previous loading scripts. Combining the search through the history of GTPlayground pages with the preview of a page provides a quick and convenient solution.
Adding preview increases dramatically the usefulness of the interface. It is now up to you to fine tune its behavior to fit your workflows.