Debugging a duplicated behavior with GTInspector
I have just spent a beautiful 15 minutes tracking a bug down. It was so exciting that afterwards I decided to spend 2 days documenting the experience because I think it offers an elaborate example of how transformative development workflows can be with moldable tools in a live environment.
The bug in question was reported recently and it is related to the GTDebugger version that we introduced recently in Pharo.
The problem looks as follows. Triggering an action from the context menu of a stack seems to trigger twice the action. This is particularly visible when a window is spawned twice, such as when trying to see the implementors of a method from the stack.
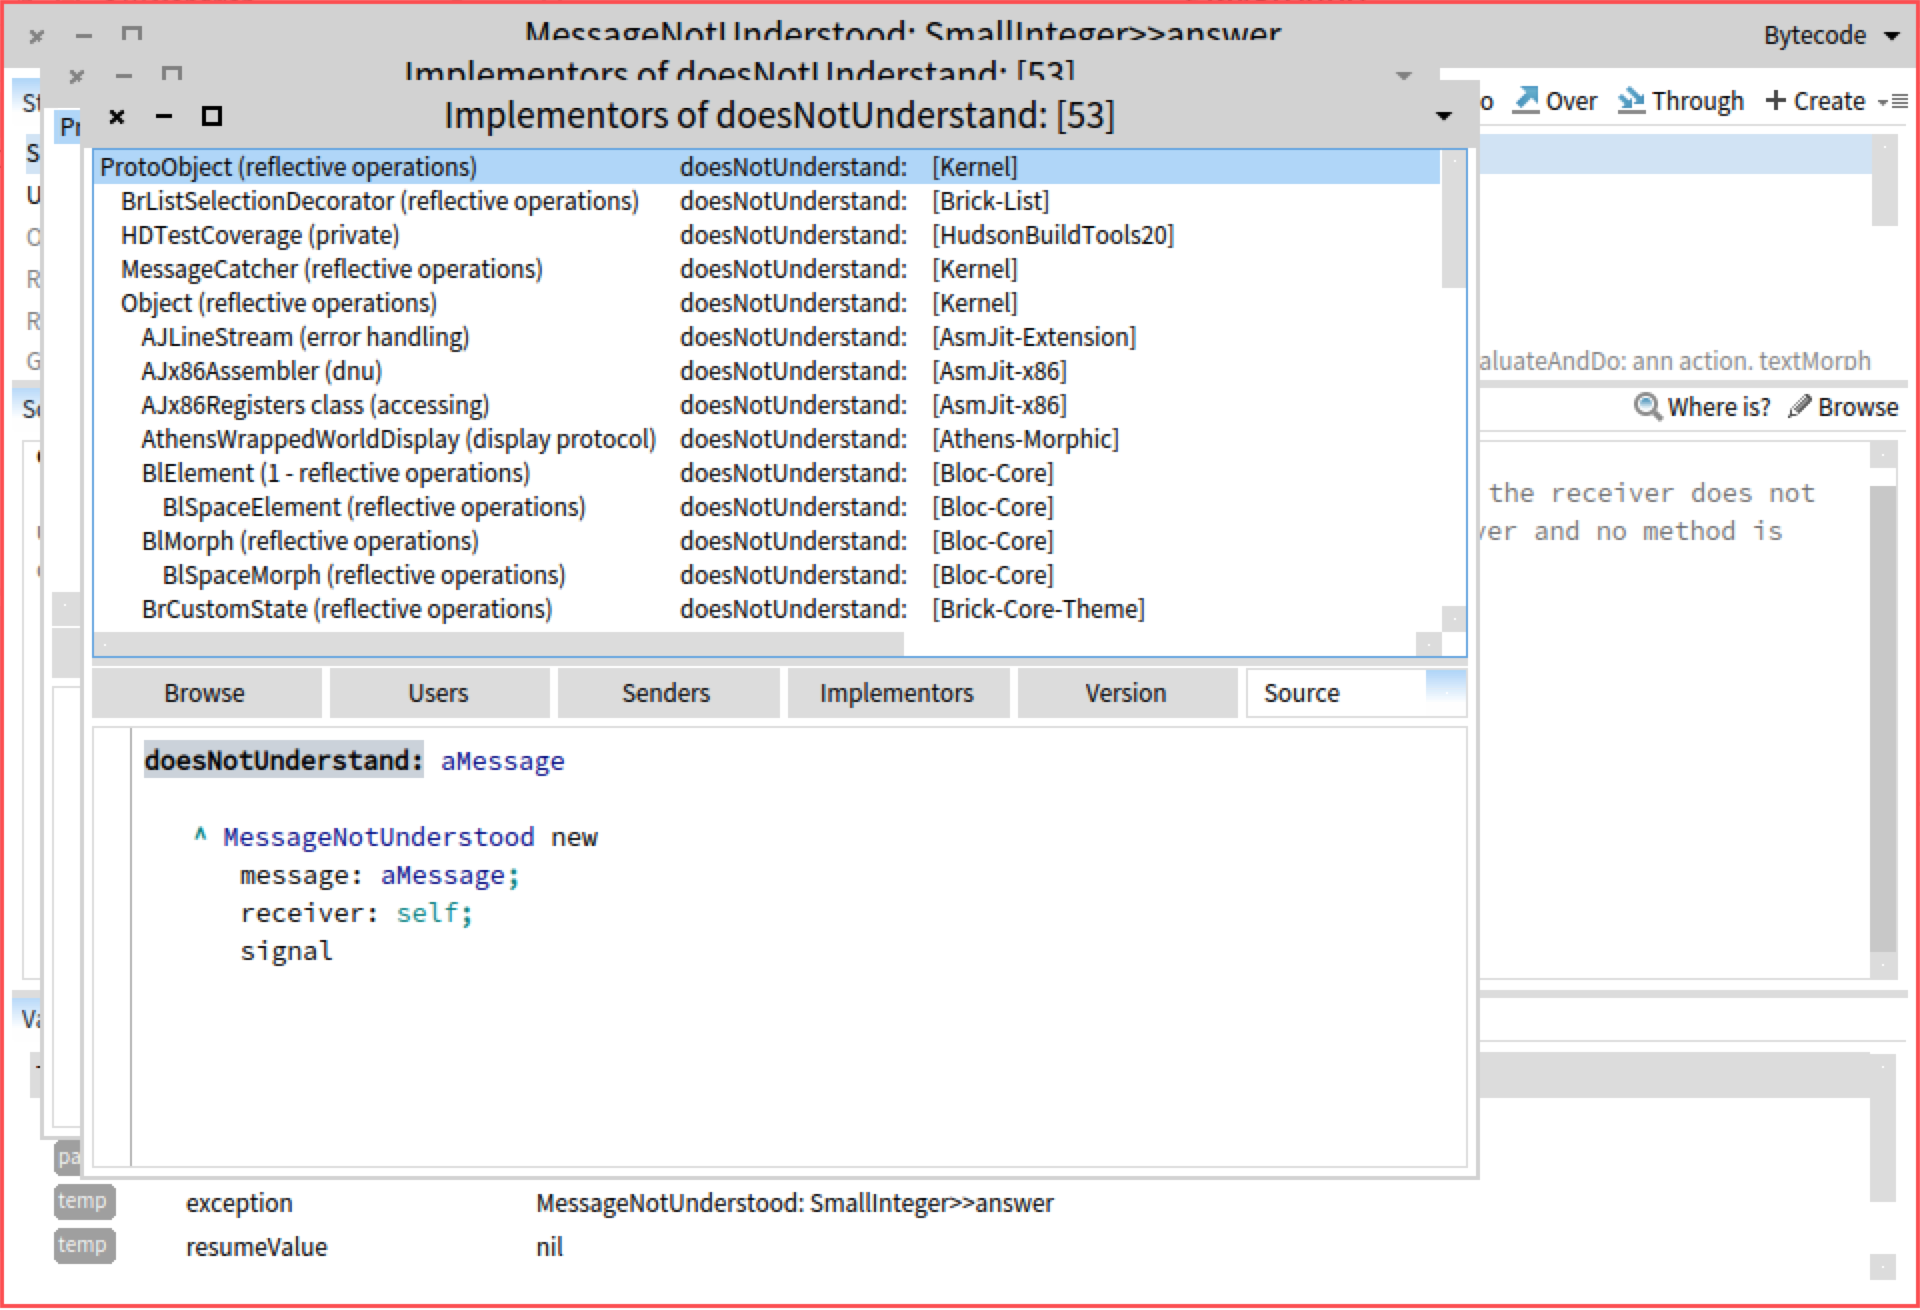
This is a tricky problem, and it can come from all sorts of places. What is certain, is that at some point there are two executions of spawning the implementors window. The debugger defines this action in the GTMoldableDebugger>>browseMessages method. We put a breakpoint in the method, and indeed, it is being executed twice. Exploring the stack in both cases does not seem to reveal anything meaningful. The stack looks the same, so likely the problem comes from different objects, not from different messages.
To reason about this, we need a different presentation. Ideally, we would like to see the complete execution and check the points in which the execution branches. This information is not apparent in a classic debugger because it mainly shows only the active stack and we are interested in the tree.
Nevertheless, as the tree is what we care about we should be able to build it. To do this, we utilize the Beacon logging engine, and we replace the breakpoint with a logging statement that records the stack of contexts (ContextStackSignal log).
GTMoldableDebugger>>browseMessages
"Present a menu of all messages sent by the current message.
Open a message set browser of all implementors of the message chosen.”
self currentMessageName ifNotNil: [
ContextStackSignal log.
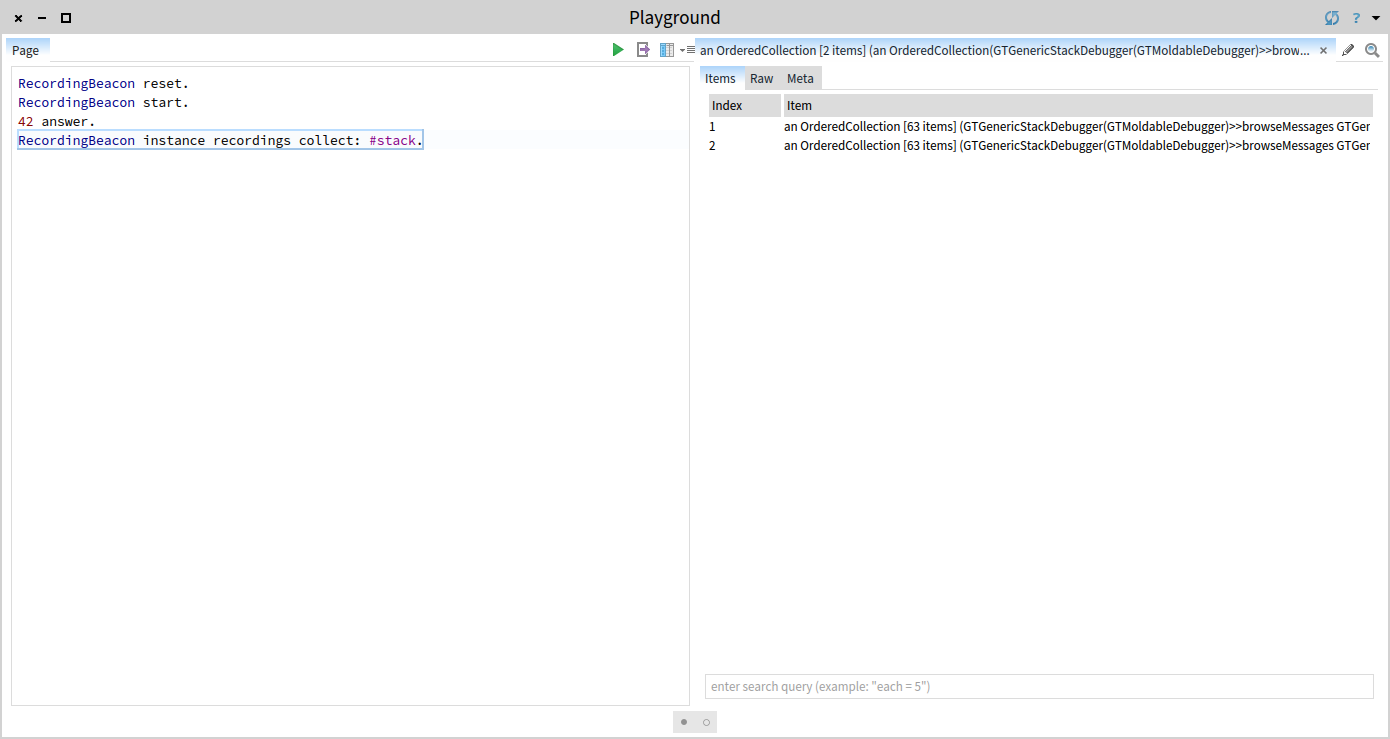
self systemNavigation browseAllImplementorsOf: self currentMessageName ]We turn on recording with RecordingBeacon start. We trigger the problem again: we inspect 42 answer, and then look for implementors. And we start exploring the recordings with GTInspector.
RecordingBeacon instance recordings collect: #stack
As expected there are two such collection of stacks, where the elements in each stack are context objects.
We switch to the Raw inspector presentation of the collection object, and we try to visualize the entries in the two stack in one picture. We use the RTMondrian builder of Roassal to script the visualization. We concatenate the stack entries in one set, we draw edges between consecutive entries, and we arrange the graph in a tree. We use a set because some of the entries will be the same:
| view |
view := RTMondrian new.
view shape label text: [:each | each gtDisplayString truncate: 50 ] .
view nodes: (self first, self second) asSet.
self first
overlappingPairsDo: [ :a :b |
view edges
connectFrom: [:x | b ]
to: [:x | a ] ].
self second
overlappingPairsDo: [ :a :b |
view edges
connectFrom: [:x | b ]
to: [:x | a ] ].
view layout tree.
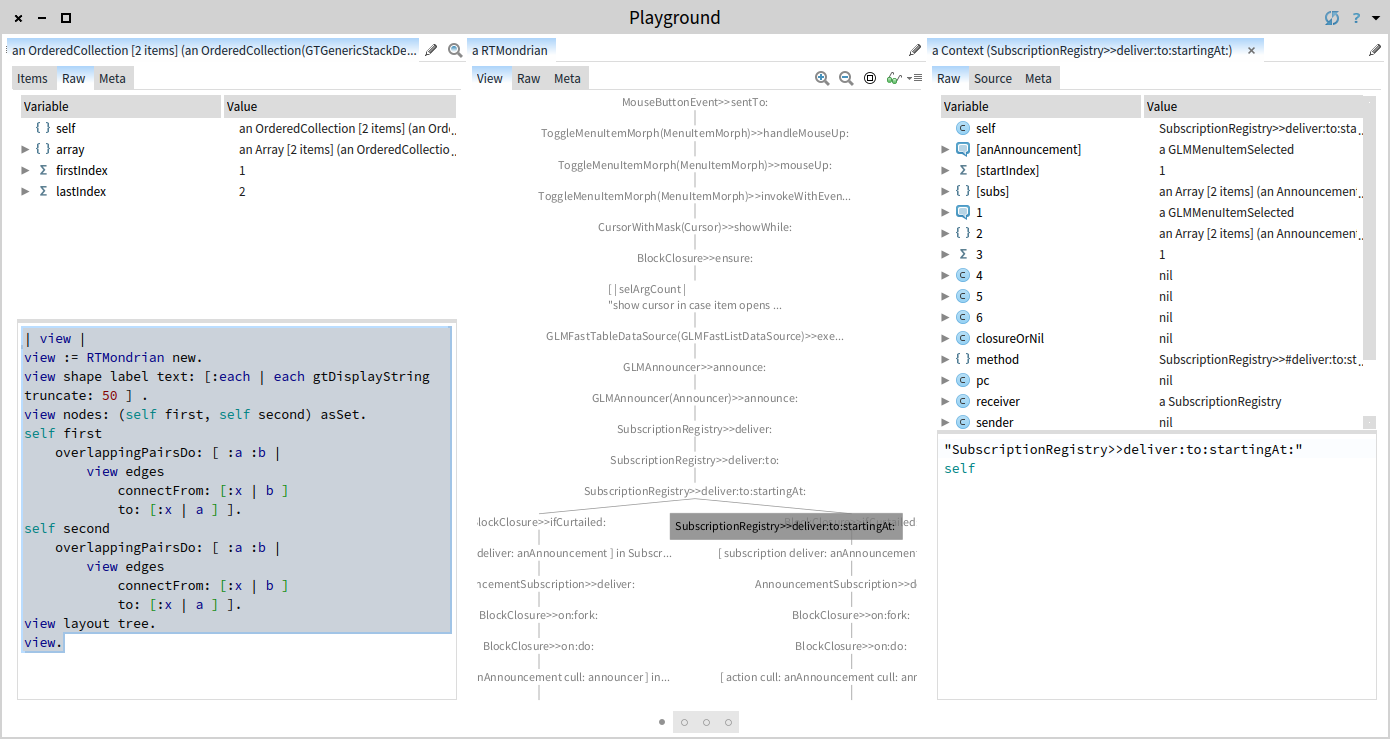
view.Executing in place this script shows us the execution tree.
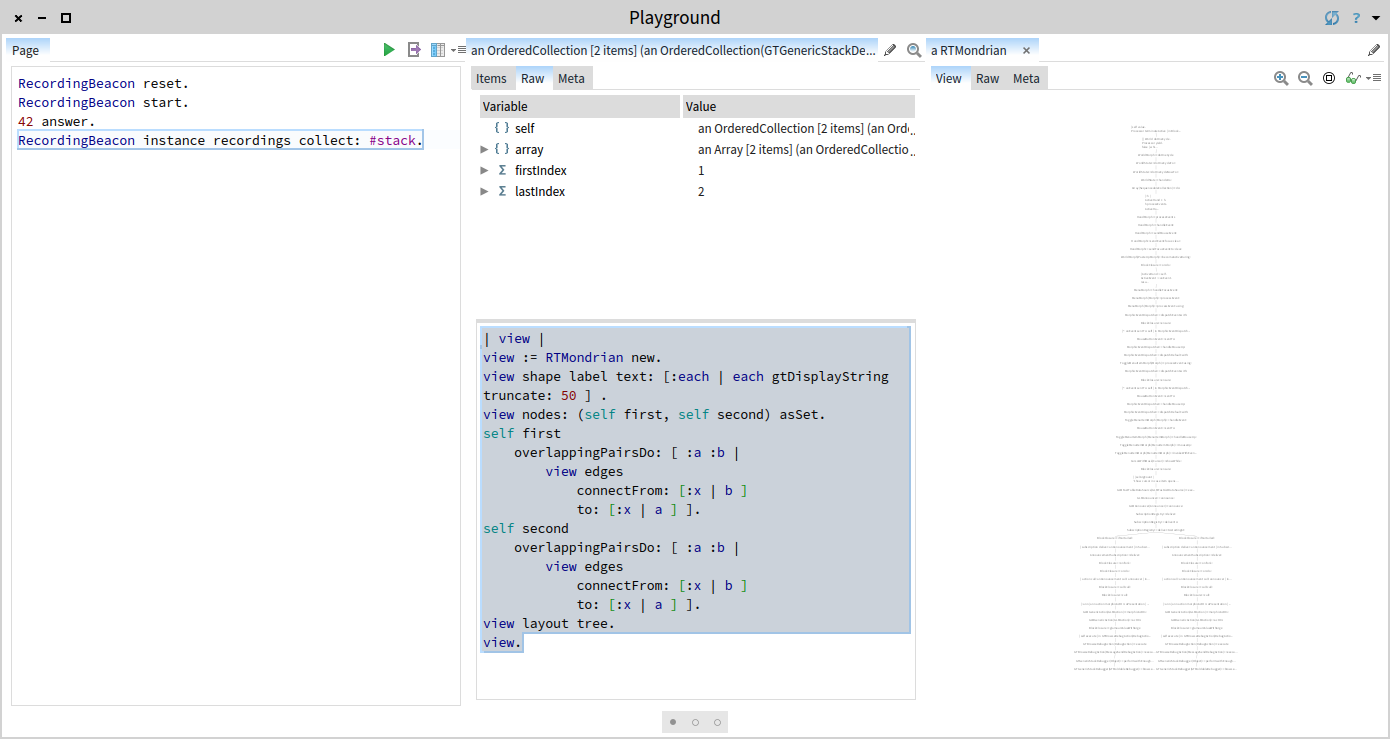
There seems to be one place which branches the execution. Let’s zoom in to see the details.
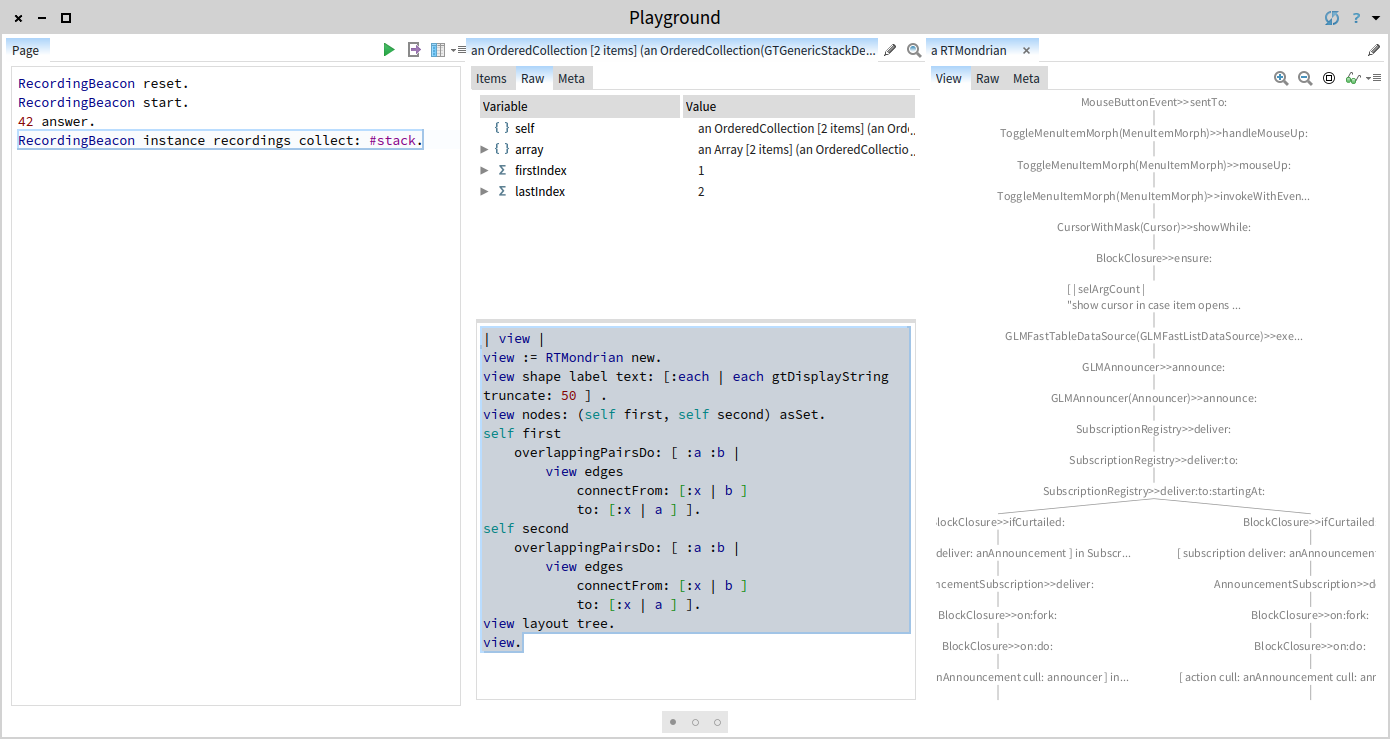
We see that the stack on both branches looks the same in terms of the executed methods. Let’s see if the difference is in the objects that are executing the two branches. For this, we inspect the context before the branching happens.
We look at the receiver.
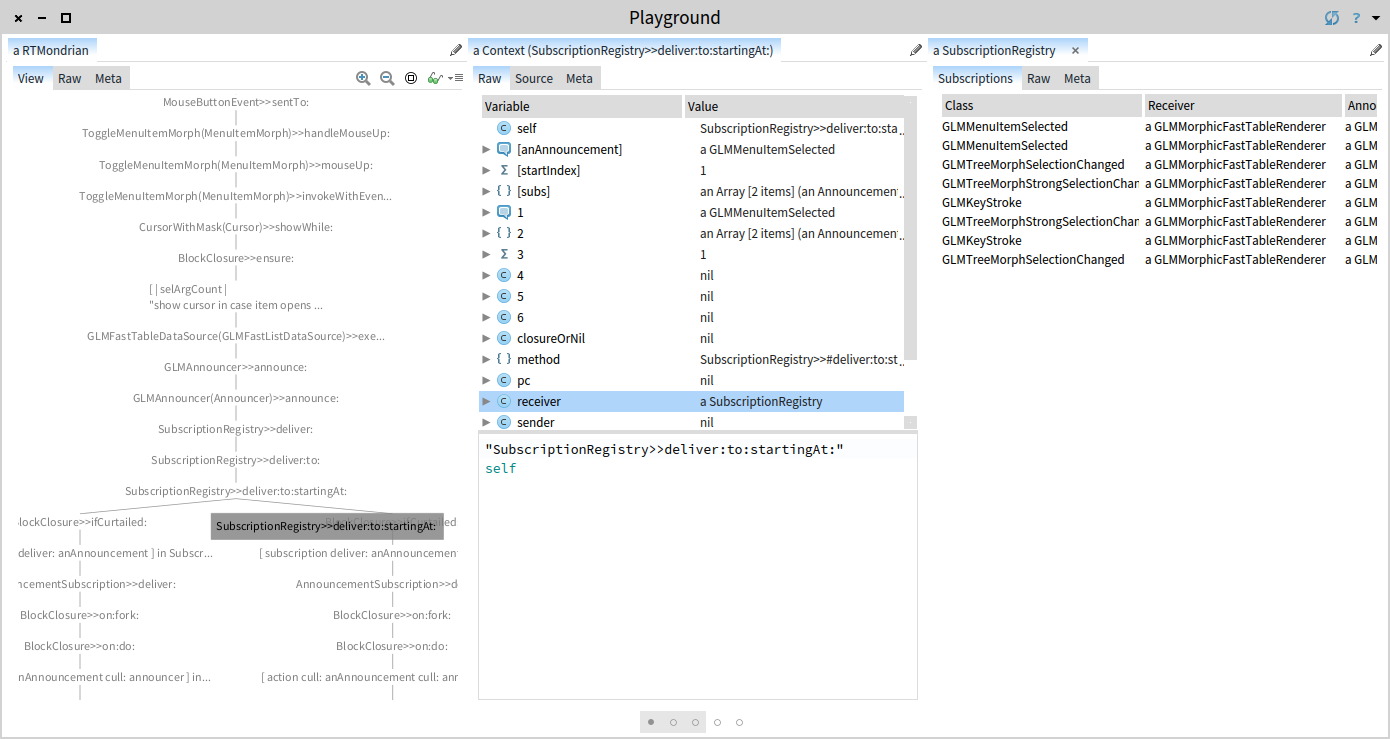
It’s a SubscriptionRegistry which is used by objects interested in announcements. At a closer look, we notice that all announcement, such as GLMMenuItemSelected, seem to be registered twice. This points us towards the direction of a bug in Glamour, the browsing engine on top of which the GTDebugger is implemented. Glamour uses this type of announcements to bind what happens in the concrete Morphic world, and the logical model of the browser.
Armed with this new hypothesis, we can now create a smaller experiment in which we isolate the creation of a FastTable-based list in Glamour.
GLMCompositePresentation new
    with: [ :c |
        c fastList selectionAct: #inspect entitled: 'Value' ];
    openOn: (1 to: 42)
And indeed, in the resulting browser, executing the action via the contextual menu results in two inspector being opened. This means that the problem is actually not related to the GTDebugger but to Glamour. At the same time, a replacing fastList with list does not exhibit the problem, which means that our bug is located somewhere in the binding between FastTable and Glamour. This hypothesis would make sense given that the FastTable support was only recently introduced in Glamour and thus, it can still have bugs.
To figure it out, we would need to debug this. We could try putting a breakpoint in installActionsOnModel:fromPresentation:, but that would imply that if we would use the GTDebugger, our image would go in a loop with the breakpoint trying to spawn a debugger, and the opening of the debugger hitting a new breakpoint.
So, we take the same route as before, and we insert a logging statement that captures the current stack. This time, we look only at methods because it is probably enough:
installActionsOnModel: aMorphicModel fromPresentation: aPresentation
MethodStackSignal log.
aMorphicModel when: GLMMenuItemSelected do: [ :ann | ann action morphicActOn: aPresentation ].
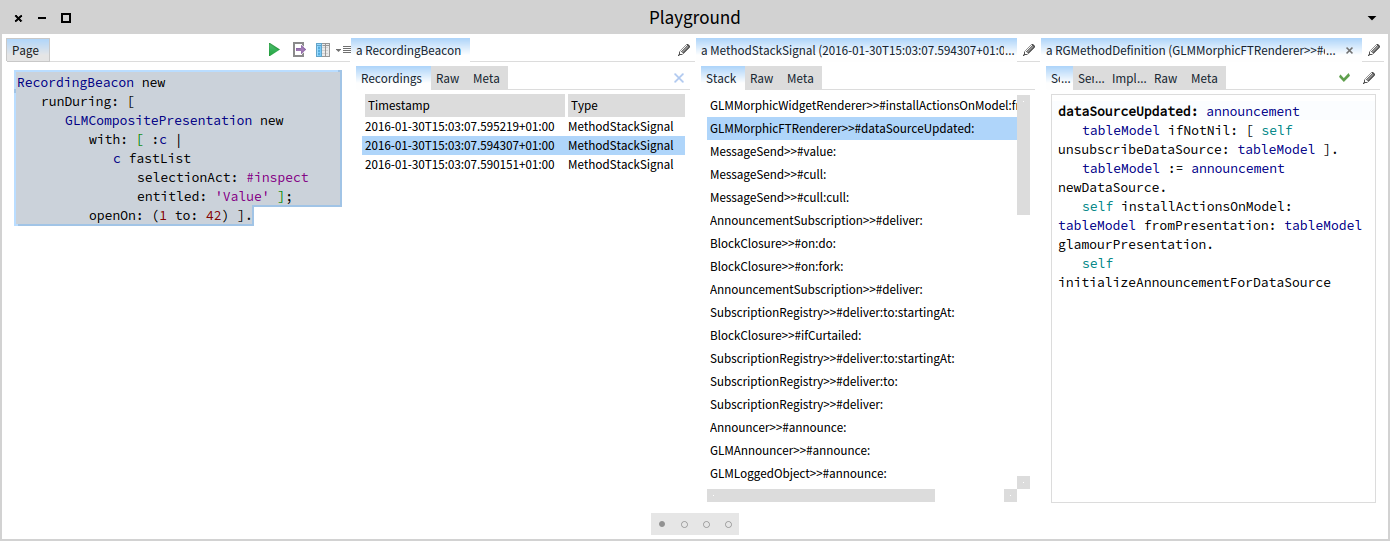
aMorphicModel when: GLMKeyStroke do: [ :ann | ann action actOn: aPresentation ].This logging statement is placed deep in Glamour. As the GTInspector is based on Glamour, looking at the global log recorder would reveal many appearances of this log entry that are not related to our problem. So, we scope the recording only to the execution of the creation of our browser:
RecordingBeacon new
    runDuring: [
        GLMCompositePresentation new
            with: [ :c |
                c fastList
                    selectionAct: #inspect
                    entitled: 'Value' ];
            openOn: (1 to: 42) ].
Inspecting the result shows us the recordings.
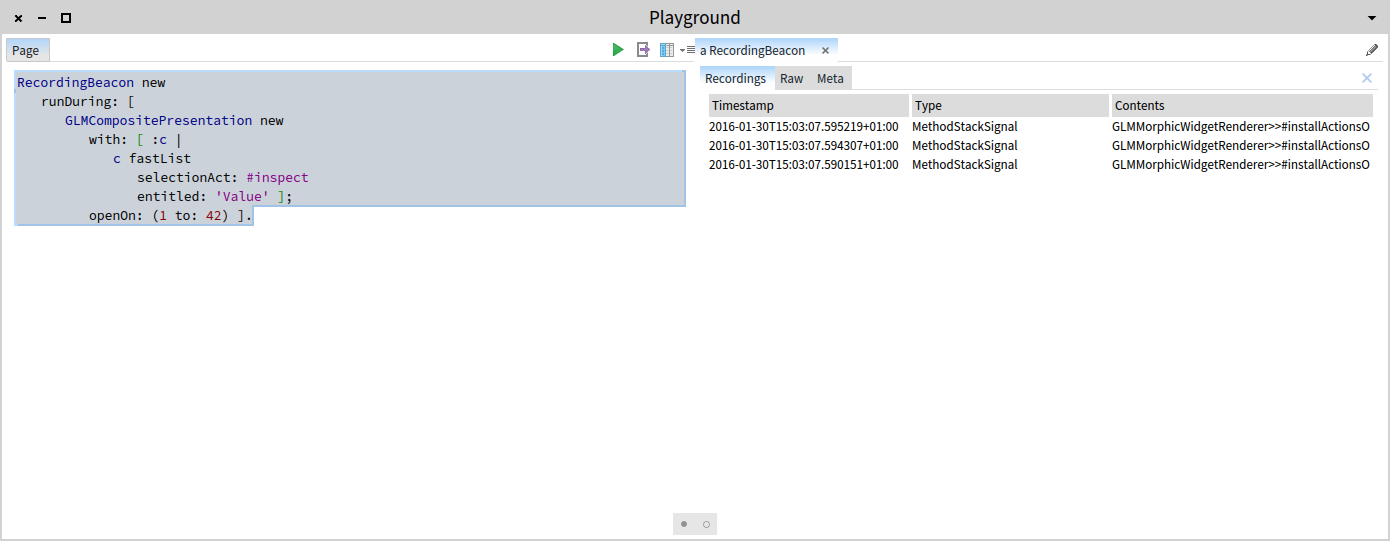
There are three such recordings. One is related to the window rendering, and two are related to FastTable. We explore the first one, and it is being called from the render: method. We explore the second one, and it comes from a method called dataSourceUpdated::
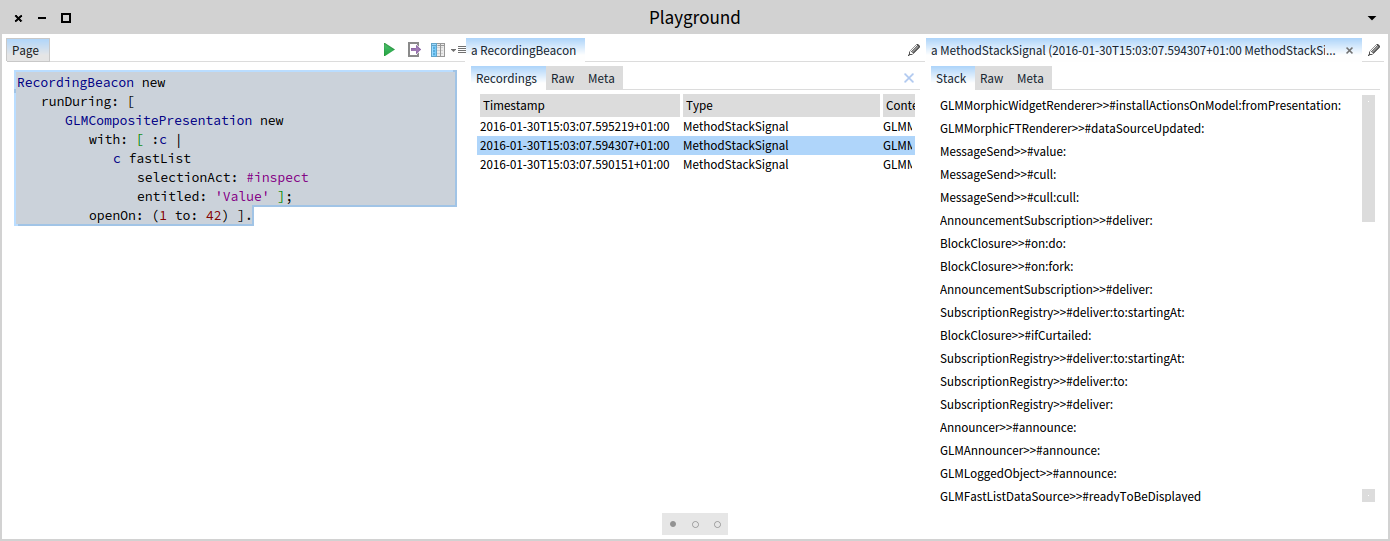
We look at the dataSourceUpdated: method (notice how we essentially have a postmortem debugger in the inspector):
And indeed, this method erroneously calls installActionsOnModel:fromPresentation::
dataSourceUpdated: announcement
    tableModel ifNotNil: [ self unsubscribeDataSource: tableModel ].
    tableModel := announcement newDataSource.
    self installActionsOnModel: tableModel fromPresentation: tableModel glamourPresentation.
    self initializeAnnouncementForDataSource
Now we know where the problem comes from, but we are not done yet. We still have to document our finding. In this case, the most appropriate way is to write a red functional test to capture the problem of multiple announcements with the same type being registered for a FastTable:
testNoDuplicateRegistrationOfAnnouncementsOnDataSource
    | table amountOfMenuItemSelectedSubscriptions |
    window := GLMCompositePresentation new
            with: [ :c |
                c fastList selectionAct: #inspect entitled: 'Value' ];
            openOn: (1 to: 42).
    table := self find: FTTableMorph in: window.
    amountOfMenuItemSelectedSubscriptions := table dataSource announcer subscriptions glmSubscriptions count: [ :each | each announcementClass = GLMMenuItemSelected ].
    self assert: amountOfMenuItemSelectedSubscriptions equals: 1
Then we remove the troubling line, and check that the test is green.
Now we are done.
Remarks
Let’s take a step back and look at the ingredients of this session. We guided all our steps through hypotheses following the humane assessment philosophy. As a consequence, at every point we knew where we were and why we were there. And we guided our actions by testing these hypotheses through custom made analyses.
To make this practical, we need tools that allow us to go through these scenarios inexpensively and live. With Pharo this is now a reality.
Looking at the details, our analysis involved actions such as:
- recording the stack through a logger,
- inspecting the stack postmortem with the inspector,
- visualizing multiple stacks together, or
- scoping the recording to a particular part of the execution.
Granted, these are typically perceived as advanced actions, but they really are not that complicated.
One thing that might appear hard is the idea of recording the execution context and then utilizing the inspector to debug. I reported on this technique before. On that occasion, I did it by directly inspecting thisContext. In the current case I used Beacon because (1) it makes it even easier to capture the stack as a log signal and offer it for later inspection (e.g., ContextStackSignal log), and (2) it has a convenient way to scope log capturing.
Another thing is the use of visualization which proved to be essential for solving our problem. It helped us analyze the two initial stacks in one meaningful picture that helped us quickly discover the point to look at (i.e., the branching point). This was possible exactly because we could embed that Roassal visualization right in place with little effort. It does require some learning, but together with the deep integration in the Glamorous Toolkit it brings with it a complete new way of exploring objects.
In my book, this session counts as cool. If you agree, we just labelled a debugging session as cool. And this is not at all an isolated case. It is actually rather common in my world. That is because debugging, and assessment in general, is an exciting activity. Can you say the same? If not, I invite you to start exploring what Pharo has to offer and go beyond the typical routine. You will be surprised.