Evaluating the reimplementation of key Context methods in Pharo
The Context class in Pharo is an essential one that models the activation of either a method or a block. A context instance can be obtained through the thisContext variable from anywhere in the code and it offers an entry point to manipulating the current execution.
For example, it offers information about the sender or about the receiver of the last message. This means that this object offers the entry point for debugging support: essentially the debugger is an inspector of this object. That means that you can do interesting things, such as debugging the debugger with the inspector.
What can I say. It’s a fun object to play with.
But, recently I stumbled across a little problem that Eliot pointed me to. Essentially, for it to work properly, the context object should directly work with the virtual machine and restrain itself from sending messages to the current receiver object. Unfortunately, in Pharo, this is not yet the case, and this leads to unwanted side effects.
Let's identify the culprit methods. Essentially, we want to find all non-extension methods that either:
- send a message to
self receiver, or - send a message to the
receiverinstance variable.
Of course, we do not want to rely on code reading. Even if the class is not very large, code reading is just not appropriate. Instead, we can write a query over the abstract syntax trees of all methods in the Context class:
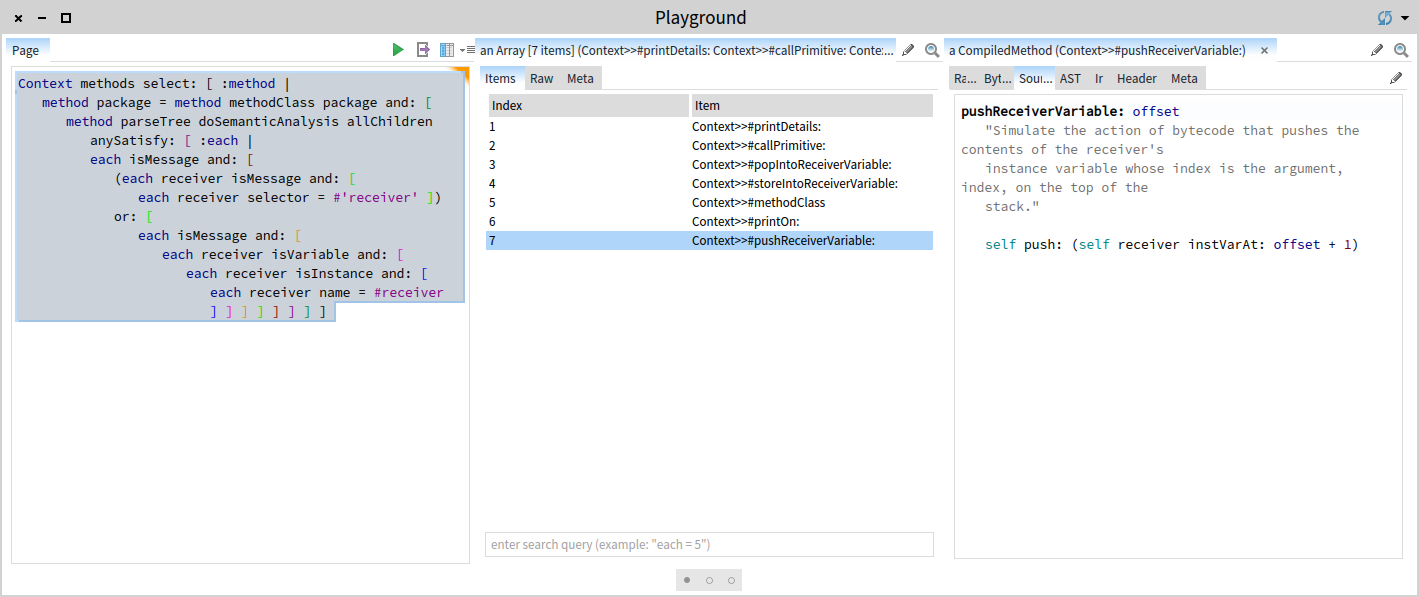
Context methods select: [ :method |
    method package = method methodClass package and: [
        method parseTree doSemanticAnalysis allChildren
            anySatisfy: [ :each |
            each isMessage and: [
                (each receiver isMessage and: [
                    each receiver selector = #'receiver' ])
                or: [
                    each isMessage and: [
                        each receiver isVariable and: [
                            each receiver isInstance and: [
                                each receiver name = #receiver
                                ] ] ] ] ] ] ] ]
This query is rather long. It took me about 7 minutes. And I did not write it all at once. The way I wrote this was essentially by picking one method that I knew was problematic, and looking at its abstract syntax tree with the GTInspector. This allowed me to understand how the pattern I was looking for is actually represented in the tree, and write the query for it.
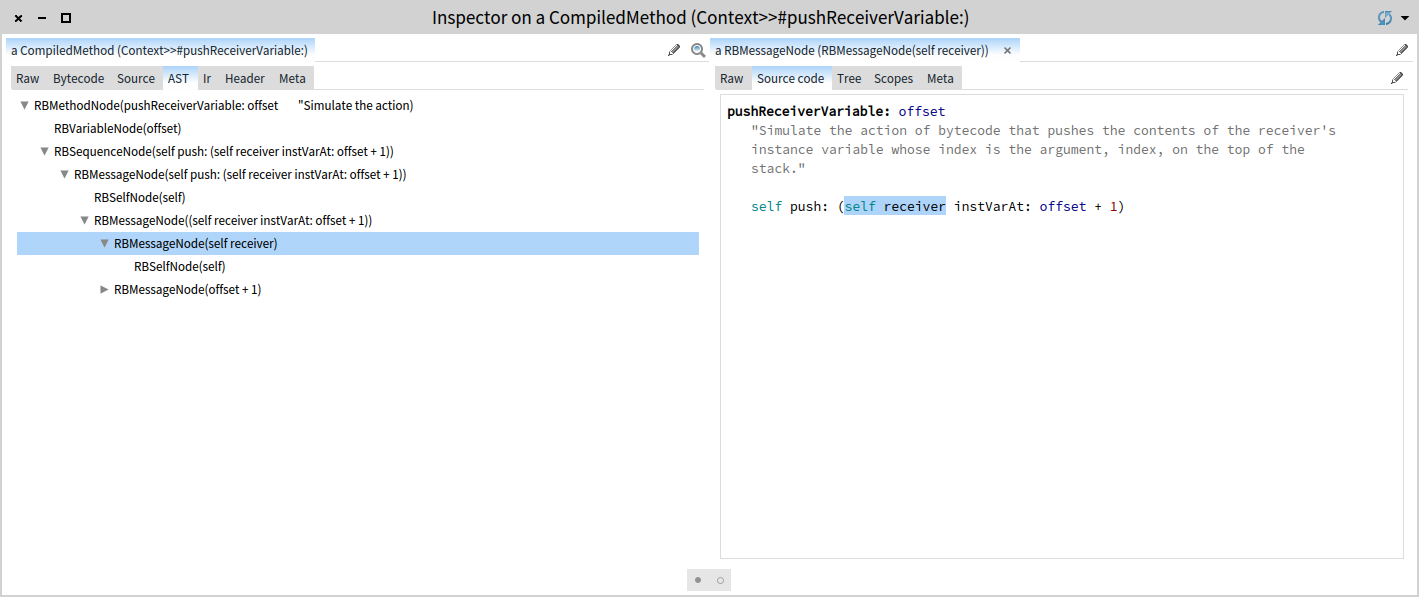
Inspecting the result of the above query in the GTInspector offers us a quick browser for only the problematic methods. Now we can read the code.
Once we have this query, besides obtaining support for browsing, we can also use it for regression testing to ensure that such an important constraint is preserved in the future.