GTDebugger in Pharo 5.0
After GTInspector, GTPlayground, and GTSpotter, it is time for GTDebugger to enter the main Pharo arena. GTDebugger is part of the Glamorous Toolkit project and it is mainly driven by Andrei Chis. Since several years it acts as the default debugger in the Moose environment. Still, even if it is a mature implementation, the debugger is a critical development tool in Pharo and a new solution can affect significantly the workflow of developers. This post offers an overview of these differences and some practical information.
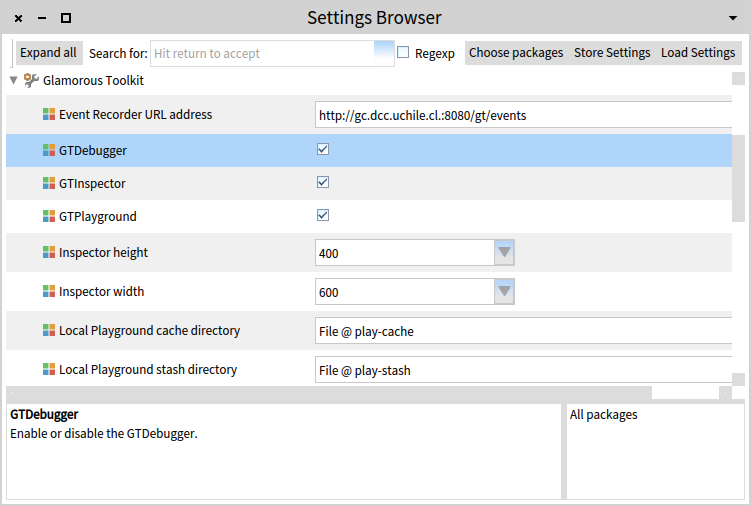
We should note from the start that, to make the transition smoother, GTDebugger can be easily turned on/off through a setting.
The generic stack debugger
The default incarnation of the GTDebugger comes with a slightly different interface than the previous debugger, so let’s take a tour.
Similar to the classic debugger structure, the stack is on top-left, and code is on the top-right, and the variables are offered at the bottom.
In the current state, the GTDebugger is implemented in Glamour, and this influences the way actions are being distributed. Thus, the stack manipulation actions (e.g., step into or step over) are offered in the stack pane, while code related actions (e.g., browse) are offered in the code pane.
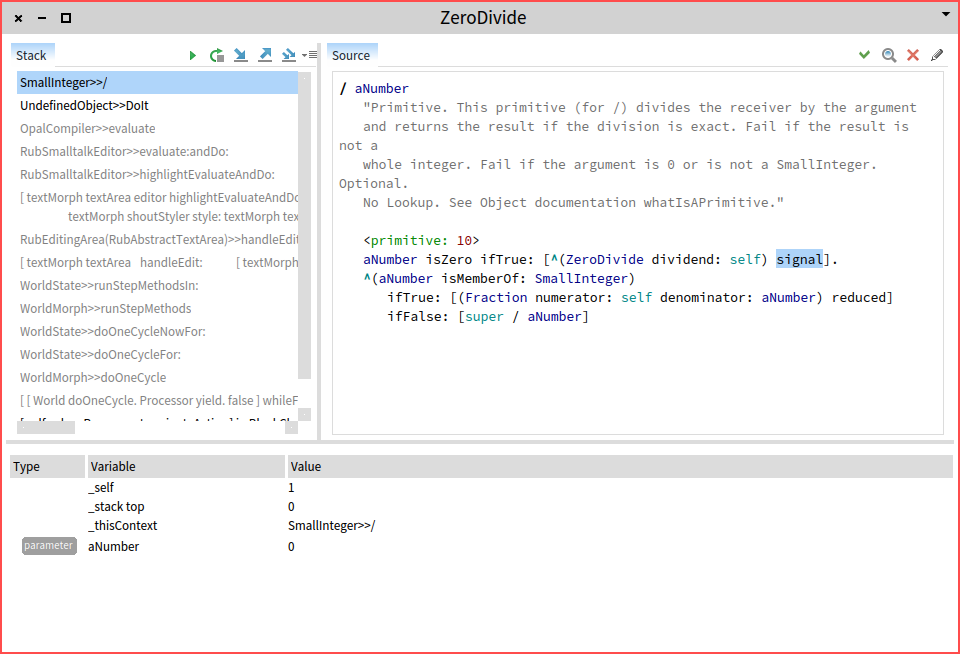
One thing to note is that the variables at the bottom are offered in a fully functional GTInspector.

Another particularity is that the stack highlights some of the entries. For example, in the below screenshot you can observe a debugging session corresponding to the start of an inspector. The second method activation is highlighted in blue to denote that it is a method situated in the same class as the current method, and the following two are marked with black to show that they belong to the same package:

The moldable debugger
While the generic debugger has only minor differences to the classic one, the main difference comes from what cannot be easily seen. Like all other tools from the Glamorous Toolkit, GTDebugger is moldable by design. In the case of the inspector each object can influence the displayed presentations. In the case of the debugger, it is the execution context that can decide the presentation and interaction logic.
This means that we can easily create custom debuggers for different libraries. The main distribution comes with two such custom debuggers: the SUnit debugger, and the bytecode debugger. These are both useful and provide examples of how the debugger can be customized.
The SUnit debugger) provides a simple customization that shows a diff view when assert:equals: is present in the debugged stack. This might sound trivial, and it indeed it is relevant in only some cases, but detecting fine-grained differences between the expected result and the provided result is a problem is every IDE I know. It is indeed simple, but it is one of those examples of how simple things should actually be simple. This is important because simple things add up and they end up constructing the overall user experience.
This extension is found in the GT-SUnitDebugger package and it totals 132 lines of code. That should fall in the inexpensive category.
Let’s now take a look at the bytecode debugger. This one again customizes the presentation in a couple of ways:
- a new bytecode view appears to the right of the code pane, and
- the inspector variables appear listed with more bytecode-relevant labels (e.g.,
1,rcv1).

Another relevant part in a debugger is the way we can navigate the execution space. Thus, actions such as 'step over' should be controllable by the programmer of a debugger. In the case of the bytecode debugger, a desired action is to be able to step to a specific bytecode.
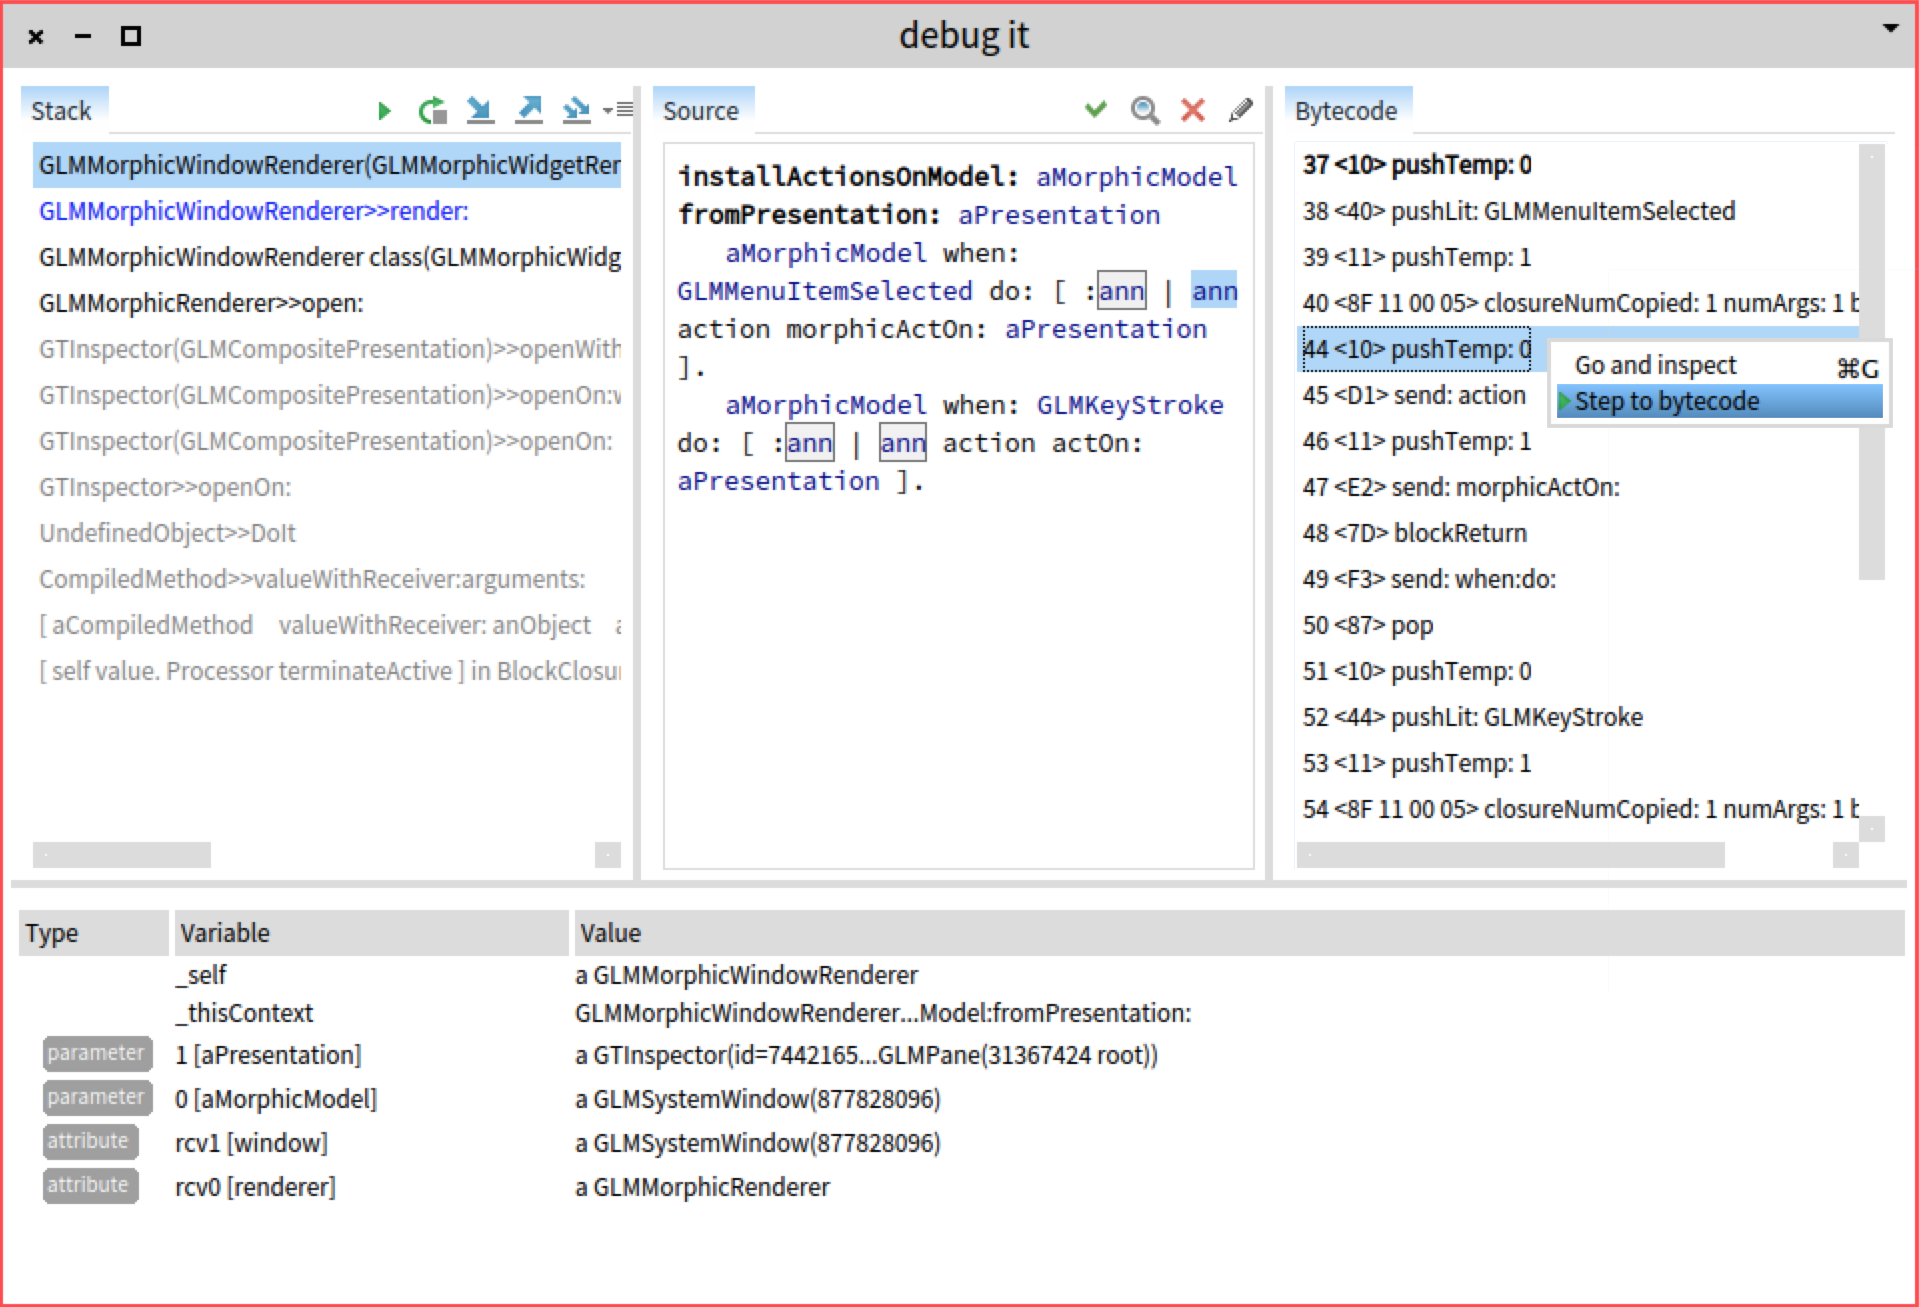
The implementation of this debugger consists of 165 lines of code.
Summary
The GTDebugger is a new take on debugging. At first glance, it looks similar to any other debugger, but its moldable nature and customization costs measured in only hundreds of lines of code paves the way for a significant departure from classic debugging.
To get you started, the core distribution comes with two concrete custom incarnations. Actually there are three: the generic stack debugger is implemented in the same way. There exists others for different libraries, such as PetitParser or Glamour, but these default ones already offer a beginning of documentation.
You can read more about the GTDebugger here:
- Initial blog post
- Main webpage
- Recent publication: Andrei Chiş, Marcus Denker, Tudor Gîrba, and Oscar Nierstrasz. Practical domain-specific debuggers using the Moldable Debugger framework. In Computer Languages, Systems & Structures 44() p. 89—113, 2015. Special issue on the 6th and 7th International Conference on Software Language Engineering (SLE 2013 and SLE 2014).