Blog

Steering Agile Architecture at GOTO Academy, Zurich, March 3-4

Next week, during March 3-4, I will give a course at GOTO Academy on Steering Agile Architecture. The registration form can found on the event website.

The course is based on the humane assessment method and it offers a novel and practical approach to dealing with architecture in an agile project. It is based on interactive sessions, it offers live demos, and exemplifies the lessons through real-life case studies.

Posted by Tudor Girba at 25 February 2016, 12:03 pm with tags course, assessment, architecture link
|

Short spotter demos

Spotter looks deceptively simple. Indeed, Spotter provides a simple user interface language, but when this is combined with all sorts of custom search implementations, the simple interface turns into a machine that can support literally hundreds of search scenarios. Previous posts tried to describe Spotter through pictures, but to get a better idea of what the interface can do, here are some live demos that exemplify the basic actions through the lenses of common search scenarios in Pharo.

Posted by Tudor Girba at 24 February 2016, 9:59 pm with tags gt, moose, pharo link
|

Gtoolkit 3.10 in Pharo 5.0

We recently integrated GToolkit version 3.10 into Pharo 5.0. This was not a major version, but still there are some notable changes. Here they are.

Senders, References, Messages in GTSpotter

Spotter now includes top-level search processors for finding senders and references. The implementation of senders and references were covered in a previous post. Given that Senders is a common case, we wanted to not have another processor that would start with #S. For this reason we followed the suggestion of David Allouche and renamed the previously existing #Selectors category into #Messages. This way we can use #s shortcuts for spotting senders.

Support for only one matching category in GTSpotter

One issue that popped up during the recent discussions on the Pharo mailing list was that if the search only has matches in one category, the whole result should be inlined in the current step rather than requiring to dive in the category. This is now possible with the excellent work of Stefan Reichhart.

While the change might sound trivial, the implementation was not because it required us to introduce the concept of resumable search processor: after the default search finishes, if there is only one available processor, the search continues where it left off and continues to stream the results.

In essence, this feature means that if you are searching for a specific category you will get all results in one step.

Senders-one-category.png

Manageable extensions for GTSpotter

There has been quite a lot of debate about what processors should exist in Spotter by default and what their semantics should be. Unfortunately, this discussion showed that still it is hard to convince people that Spotter is made to be extended and customized.

One thing that made the problem a bit more complicated than necessary was that Spotter comes by default with 118 extensions. So, if someone would want to provide a different meaning for a processor, this would have meant overriding the corresponding method. This solution was far from elegant.

To solve this, we have taken a different approach and exposed all extensions as settings. The list is computed automatically.

Spotter-extensions-settings.png

If the box is selected, the processor is active. If it is deselected, the processor will not be executed. As simple as that.

This also means that if you want to provide a search for #Messages that is different than the current implementation, you can deselect the current implementation and provide a separate method creating a processors with the same title. Thus, there is no need to override anymore.

And as these are first class settings, you can even export the settings and have your search preferences propagated throughout images. Quite beautiful.

GTInspector works with ProtoObject

One bug discovered recently was that the inspector was unable to work with instances of ProtoObject. Indeed, these kind of objects are not often encountered, but when they appear (for example, when dealing with proxy objects) we want to be able to inspect them. We adapted the GTInspector to handle this case. The support can still be extended, but the current implementation is already reasonable.

Inspector-protoobject.png

GTDebugger offers resize of the stack columns

Another goodie comes from Esteban Lorenzano who gracefully extended FastTable with the possibility of resizing columns. This is particularly useful in the case of large class or methods names.

Debugger-resize.png

Help support for GTInspector and GTSpotter

Both Spotter and Inspector received a help button, and triggering it spawns the associated help. The help is minimal, but the support exists. One of the things provided is the list of all extensions.

Help-spotter.png

Posted by Tudor Girba at 16 February 2016, 10:59 pm with tags gt, moose, pharo link
|

Debugging a duplicated behavior with GTInspector

I have just spent a beautiful 15 minutes tracking a bug down. It was so exciting that afterwards I decided to spend 2 days documenting the experience because I think it offers an elaborate example of how transformative development workflows can be with moldable tools in a live environment.

The bug in question was reported recently and it is related to the GTDebugger version that we introduced recently in Pharo.

The problem looks as follows. Triggering an action from the context menu of a stack seems to trigger twice the action. This is particularly visible when a window is spawned twice, such as when trying to see the implementors of a method from the stack.

Duplicated.png

This is a tricky problem, and it can come from all sorts of places. What is certain, is that at some point there are two executions of spawning the implementors window. The debugger defines this action in the GTMoldableDebugger>>browseMessages method. We put a breakpoint in the method, and indeed, it is being executed twice. Exploring the stack in both cases does not seem to reveal anything meaningful. The stack looks the same, so likely the problem comes from different objects, not from different messages.

To reason about this, we need a different presentation. Ideally, we would like to see the complete execution and check the points in which the execution branches. This information is not apparent in a classic debugger because it mainly shows only the active stack and we are interested in the tree.

Nevertheless, as the tree is what we care about we should be able to build it. To do this, we utilize the Beacon logging engine, and we replace the breakpoint with a logging statement that records the stack of contexts (ContextStackSignal log).

GTMoldableDebugger>>browseMessages
    "Present a menu of all messages sent by the current message.
    Open a message set browser of all implementors of the message chosen.”

    self currentMessageName ifNotNil: [
        ContextStackSignal log.
        self systemNavigation browseAllImplementorsOf: self currentMessageName ]

We turn on recording with RecordingBeacon start. We trigger the problem again: we inspect 42 answer, and then look for implementors. And we start exploring the recordings with GTInspector.

RecordingBeacon instance recordings collect: #stack

As expected there are two such collection of stacks, where the elements in each stack are context objects.

Playground1.png

We switch to the Raw inspector presentation of the collection object, and we try to visualize the entries in the two stack in one picture. We use the RTMondrian builder of Roassal to script the visualization. We concatenate the stack entries in one set, we draw edges between consecutive entries, and we arrange the graph in a tree. We use a set because some of the entries will be the same:

| view |
view := RTMondrian new.
view shape label text: [:each | each gtDisplayString truncate: 50 ] .
view nodes: (self first, self second) asSet.
self first
    overlappingPairsDo: [ :a :b |
        view edges
            connectFrom: [:x | b ]
            to: [:x | a ] ].
self second
    overlappingPairsDo: [ :a :b |
        view edges
            connectFrom: [:x | b ]
            to: [:x | a ] ].
view layout tree.
view.

Executing in place this script shows us the execution tree.

Playground2.png

There seems to be one place which branches the execution. Let’s zoom in to see the details.

Playground3.png

We see that the stack on both branches looks the same in terms of the executed methods. Let’s see if the difference is in the objects that are executing the two branches. For this, we inspect the context before the branching happens.

Playground4.png

We look at the receiver.

Playground5.png

It’s a SubscriptionRegistry which is used by objects interested in announcements. At a closer look, we notice that all announcement, such as GLMMenuItemSelected, seem to be registered twice. This points us towards the direction of a bug in Glamour, the browsing engine on top of which the GTDebugger is implemented. Glamour uses this type of announcements to bind what happens in the concrete Morphic world, and the logical model of the browser.

Armed with this new hypothesis, we can now create a smaller experiment in which we isolate the creation of a FastTable-based list in Glamour.

GLMCompositePresentation new
    with: [ :c |
        c fastList selectionAct: #inspect entitled: 'Value' ];
    openOn: (1 to: 42)

And indeed, in the resulting browser, executing the action via the contextual menu results in two inspector being opened. This means that the problem is actually not related to the GTDebugger but to Glamour. At the same time, a replacing fastList with list does not exhibit the problem, which means that our bug is located somewhere in the binding between FastTable and Glamour. This hypothesis would make sense given that the FastTable support was only recently introduced in Glamour and thus, it can still have bugs.

To figure it out, we would need to debug this. We could try putting a breakpoint in installActionsOnModel:fromPresentation:, but that would imply that if we would use the GTDebugger, our image would go in a loop with the breakpoint trying to spawn a debugger, and the opening of the debugger hitting a new breakpoint.

So, we take the same route as before, and we insert a logging statement that captures the current stack. This time, we look only at methods because it is probably enough:

installActionsOnModel: aMorphicModel fromPresentation: aPresentation
    MethodStackSignal log.
    aMorphicModel when: GLMMenuItemSelected do: [ :ann | ann action morphicActOn: aPresentation ].
    aMorphicModel when: GLMKeyStroke do: [ :ann | ann action actOn: aPresentation ].

This logging statement is placed deep in Glamour. As the GTInspector is based on Glamour, looking at the global log recorder would reveal many appearances of this log entry that are not related to our problem. So, we scope the recording only to the execution of the creation of our browser:

RecordingBeacon new
    runDuring: [
        GLMCompositePresentation new
            with: [ :c |
                c fastList
                    selectionAct: #inspect
                    entitled: 'Value' ];
            openOn: (1 to: 42) ].

Inspecting the result shows us the recordings.

Stack1.png

There are three such recordings. One is related to the window rendering, and two are related to FastTable. We explore the first one, and it is being called from the render: method. We explore the second one, and it comes from a method called dataSourceUpdated::

Stack2.png

We look at the dataSourceUpdated: method (notice how we essentially have a postmortem debugger in the inspector):

Stack3.png

And indeed, this method erroneously calls installActionsOnModel:fromPresentation::

dataSourceUpdated: announcement
    tableModel ifNotNil: [ self unsubscribeDataSource: tableModel ].
    tableModel := announcement newDataSource.
    self installActionsOnModel: tableModel fromPresentation: tableModel glamourPresentation.
    self initializeAnnouncementForDataSource

Now we know where the problem comes from, but we are not done yet. We still have to document our finding. In this case, the most appropriate way is to write a red functional test to capture the problem of multiple announcements with the same type being registered for a FastTable:

testNoDuplicateRegistrationOfAnnouncementsOnDataSource
    | table amountOfMenuItemSelectedSubscriptions |
    window := GLMCompositePresentation new
            with: [ :c |
                c fastList selectionAct: #inspect entitled: 'Value' ];
            openOn: (1 to: 42).
    table := self find: FTTableMorph in: window.
    amountOfMenuItemSelectedSubscriptions := table dataSource announcer subscriptions glmSubscriptions count: [ :each | each announcementClass = GLMMenuItemSelected ].
    self assert: amountOfMenuItemSelectedSubscriptions equals: 1

Then we remove the troubling line, and check that the test is green.

Now we are done.

Remarks

Let’s take a step back and look at the ingredients of this session. We guided all our steps through hypotheses following the humane assessment philosophy. As a consequence, at every point we knew where we were and why we were there. And we guided our actions by testing these hypotheses through custom made analyses.

To make this practical, we need tools that allow us to go through these scenarios inexpensively and live. With Pharo this is now a reality.

Looking at the details, our analysis involved actions such as:

  • recording the stack through a logger,
  • inspecting the stack postmortem with the inspector,
  • visualizing multiple stacks together, or
  • scoping the recording to a particular part of the execution.

Granted, these are typically perceived as advanced actions, but they really are not that complicated.

One thing that might appear hard is the idea of recording the execution context and then utilizing the inspector to debug. I reported on this technique before. On that occasion, I did it by directly inspecting thisContext. In the current case I used Beacon because (1) it makes it even easier to capture the stack as a log signal and offer it for later inspection (e.g., ContextStackSignal log), and (2) it has a convenient way to scope log capturing.

Another thing is the use of visualization which proved to be essential for solving our problem. It helped us analyze the two initial stacks in one meaningful picture that helped us quickly discover the point to look at (i.e., the branching point). This was possible exactly because we could embed that Roassal visualization right in place with little effort. It does require some learning, but together with the deep integration in the Glamorous Toolkit it brings with it a complete new way of exploring objects.

In my book, this session counts as cool. If you agree, we just labelled a debugging session as cool. And this is not at all an isolated case. It is actually rather common in my world. That is because debugging, and assessment in general, is an exciting activity. Can you say the same? If not, I invite you to start exploring what Pharo has to offer and go beyond the typical routine. You will be surprised.

Posted by Tudor Girba at 2 February 2016, 9:30 am with tags story, gt, spike, pharo, moose link
|

Spotting senders and references with GTSpotter

A recent discussion on the Pharo mailing list revealed that people would like to have the possibility of looking for senders of a symbol and references to a class in one step in Spotter. A complementary request was that when we know that we want to search only for senders, we do not want to search for anything else. Stefan Reichhart worked with me to provide the implementation for these use cases.

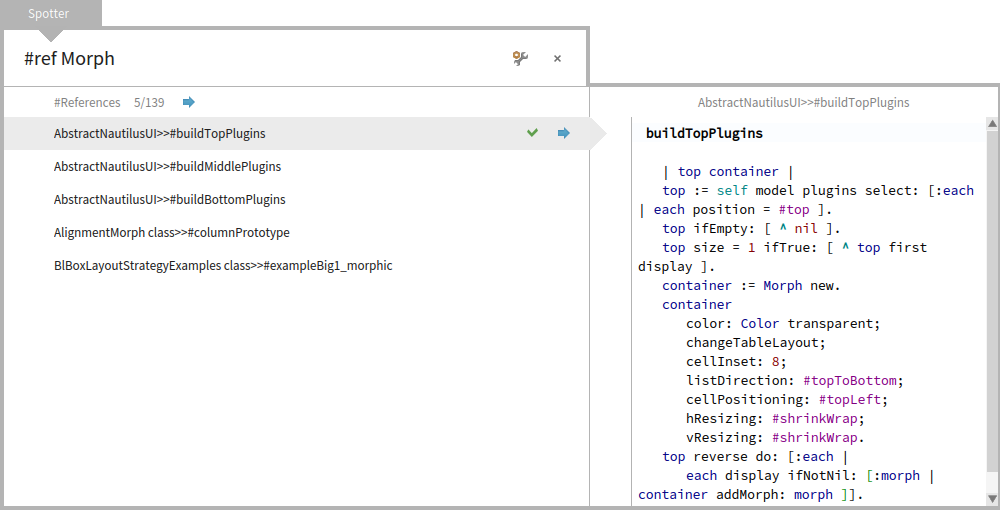
For example, searching for #ref Morph will reveal all references to the class Morph.

Spotter-references.png

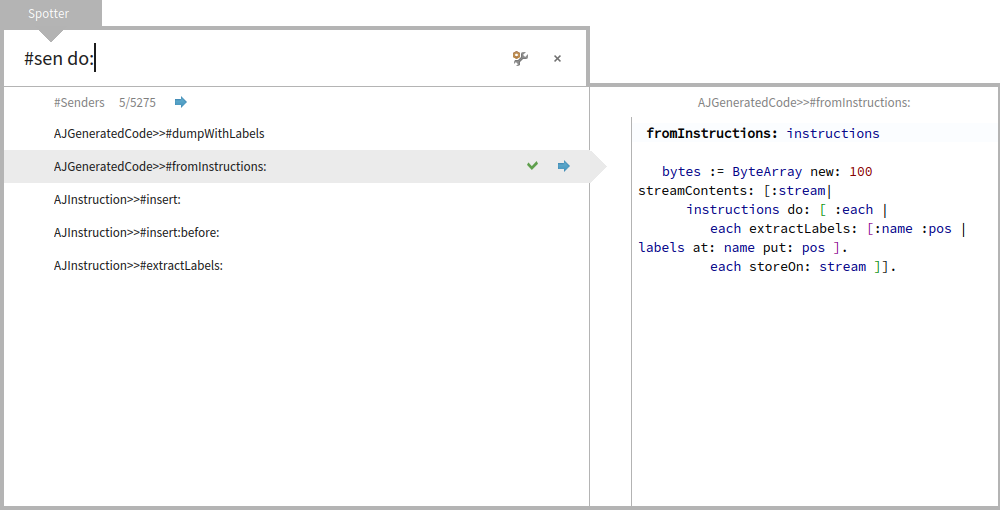
Searching for #sen do: will reveal all senders of do:.

Spotter-senders.png

Some things left to do

There are some things that are not as nice as they can be.

First, the search only shows 5 entries even if there is plenty of space for showing more. This is because right now this limit is hardcoded in the definition of the search processor. We need to make this limit more fluid to also take into account the context of the search. That is, if there is only one category shown, we should be able to see all results.

Second, the categories are not easily discoverable. Ideally, we would like an autocompletion mechanism. This issue is addressed in more details below.

Third, an interesting observation came from Ben Coman and Stéphane Ducasse on the mailing list. Ben noted that it would be interesting to have a Cmd+n, the pervasive keybinding that searches for senders, be used to autocomplete #senders in the Spotter search. At the same time, Stef came up with the idea of providing unique one-letter shortcuts for common searches. For example, in the case of senders, we could use $n. These are things we will play with soon.

A look behind the scene

This example is a good opportunity to learn how Spotter works. Let’s take a step back and look at how this is implemented.

One question that pops up often is what a word containing a hash actually means. Let’s consider the senders example. #sen is simply a filter that matches the name of the search category (in our case #Senders). Given that there is only one category that begins with #sen, only the Senders search processor will be executed and only the corresponding result category will appear.

But, what would happen if we would use only #s? Let’s see.

Spotter-senders-only-s.png

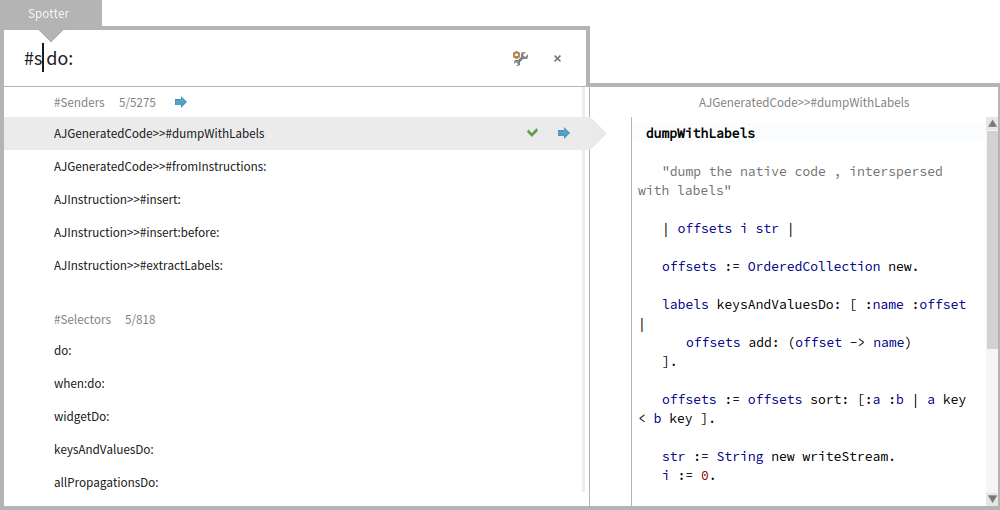
In this case, we get two categories that appear: #Senders and #Selectors.

Now, the question is how do we know what are all the categories. This is not yet as discoverable as we would want from the user point of view. One way to find this out is by simply searching for a string and then browsing through the categories that appear for that search. Still, this will only provide a way to discover a list of the categories that matched the specific search, and not all possible categories.

At the moment, the most reliable way of finding what processors are available is by looking at the implementation. Wait, that is not as hard as it might appear, especially in a live environment that allows you to narrow down on important pieces of information. Let’s see. Every Spotter processor is defined as a method in a class corresponding to objects for which we want this processor to be active. For example, as our new senders processor is available in the first step, and as the context of that first step is provided by an instance of the GTSpotter class, it follows that we should find a method in that class. Here it is:

GTSpotter>>spotterForSendersFor: aStep
    <spotterOrder: 31>
    aStep listProcessor
        title: 'Senders';
        filter: GTNullFilter item: [ :filter :context |
            SystemNavigation default
                 allSendersToString: context textTrimmed
                 do: filter ];
        wantsToDisplayOnEmptyQuery: false

This relies on a small utility method:

SystemNavigation>>allSendersToString: aString do: aBlock
    aString isEmptyOrNil ifTrue: [ ^ self ].
    aString asSymbol ifNotNil: [ :symbol |
        self allBehaviorsDo: [ :class |
            class withMethodSender: symbol do: aBlock ] ]

Please note that the implementation of this use case took 13 lines of code.

To find all processors defined in the image, we simply need to find all usages of <spotterOrder:>. This can be achieved by using Spotter itself. First we search for spotterOrder: to find the pragma type:

SpotterOrder-pragmatype.png

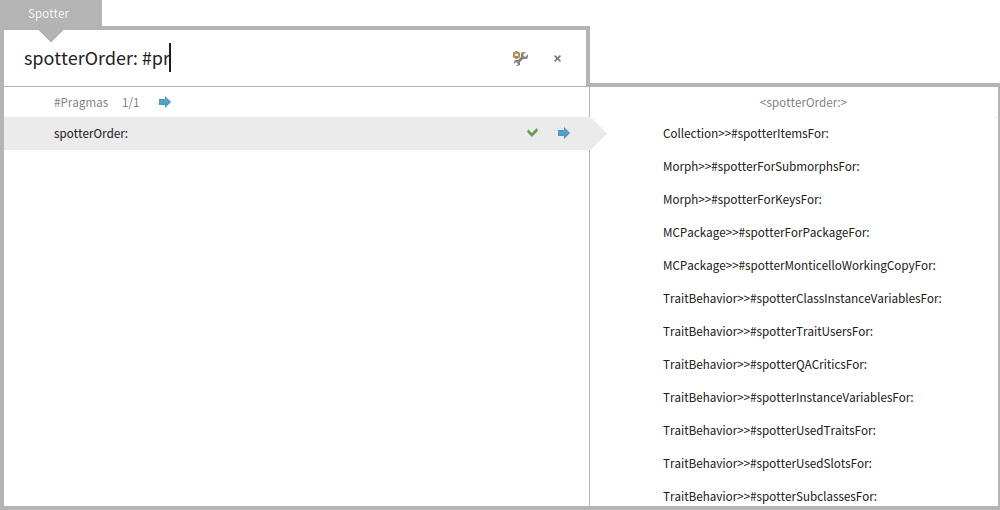
And then we dive in to find the concrete pragmas:

SpotterOrder-pragmas.png

The same information can also be found by programmatically through the Playground and Inspector, like shown previously. In fact, given that this is such a relevant query for a programmer that wants to learn about Spotter, we already have a method that provides this (currently, there are 118 processors defined in the base Pharo image). For example, the following query will return the extensions that are defined in the top GTSpotter class (there are 24 of them in the base Pharo image):

GTSpotter spotterExtendingMethods select: [ :each |
     each methodClass = GTSpotter ]

But, that is not all. Given that we want to provide live documentation, inspecting the GTSpotter class, reveals a dedicated tag with these extensions as well:

Spotter-top-extensions.png

Summary

In this post we showed that Spotter now supports two new common use cases in one step: searching for senders and for references. While at first look, this appears as a new feature, in fact this is not a special behavior, but a generic mechanism in Spotter that allows us to obtain what we need in specific cases with very little programatic customization.

We took the opportunity to take a closer look at the implementation and we learnt that the extension for senders is 13 lines long (the one for references is similar). It is hard to imagine it going smaller than this.

Getting used to this way of thinking about tools does take some effort. To ease those first steps, we also went through different ways of discovering the existing implementation.

There are certainly more that we can do in this direction, but this example shows once again that going deep down the path of moldable tools in a live environment offers a significant departure from classic IDE concepts. It’s a fun way, and we think it’s worth learning it. At least, give it 5 minutes. Play with it. In fact, let’s play together.

Posted by Tudor Girba at 19 January 2016, 2:41 pm link
|
<< 1 2 3 4 5 6 7 8 9 10 11 12 13 14 >>