Services
Let's work together to ensure that:
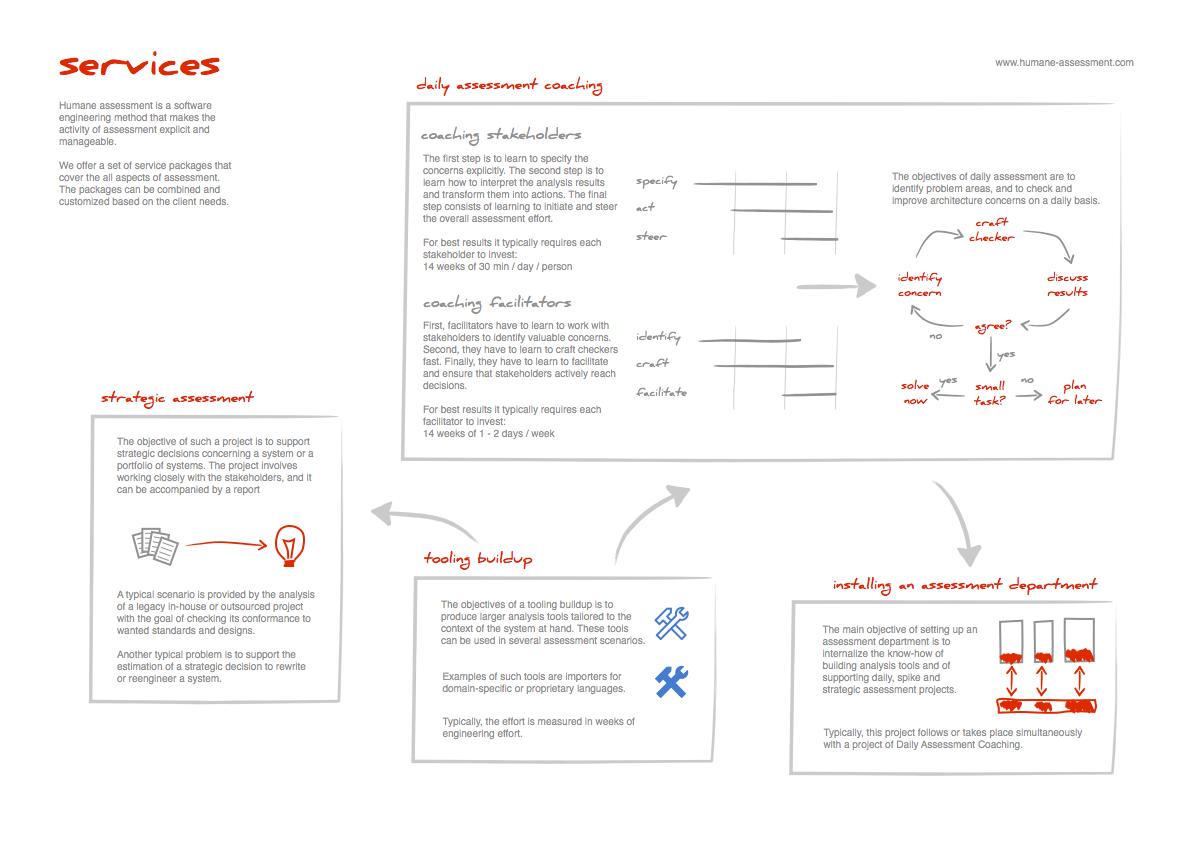
- you integrate assessment explicitly in your organization (Assessment coaching),
- you setup an assessment department (Installing an assessment department),
- you get support for a strategic assessment (Strategic assessment), or
- you get your dedicated tools built up (Tooling buildup).