Tracking a FastTable bug with GTInspector
In a previous article we looked at how moldable tools can change the development experience when tracking down a bug. The bug in question was a duplicated behaviour in GTDebugger: triggering an action from the context menu of the stack triggered that action twice.
A few weeks after that bug was fixed, another interesting bug was reported for GTInspector, affecting the navigation feature of the inspector: when an object is selected in a view, the pane to the right is created four times, as if the user selected that object four times.
In this article we detail the workflow that we followed to understand and fix this bug. This workflow consists in treating software problems as data problems, and formulating and solving one hypothesis at a time. Hence, we do not try to gain knowledge just by reading code. Instead we use tools to query and visualize our data, the code. When an appropriate tools is not available we build it. We then use the gained insight to formulate the next hypothesis and iterate until we understand the cause of the bug, and are able to fix it. As much as possible, we make all hypotheses explicit.
Reproducing the bug
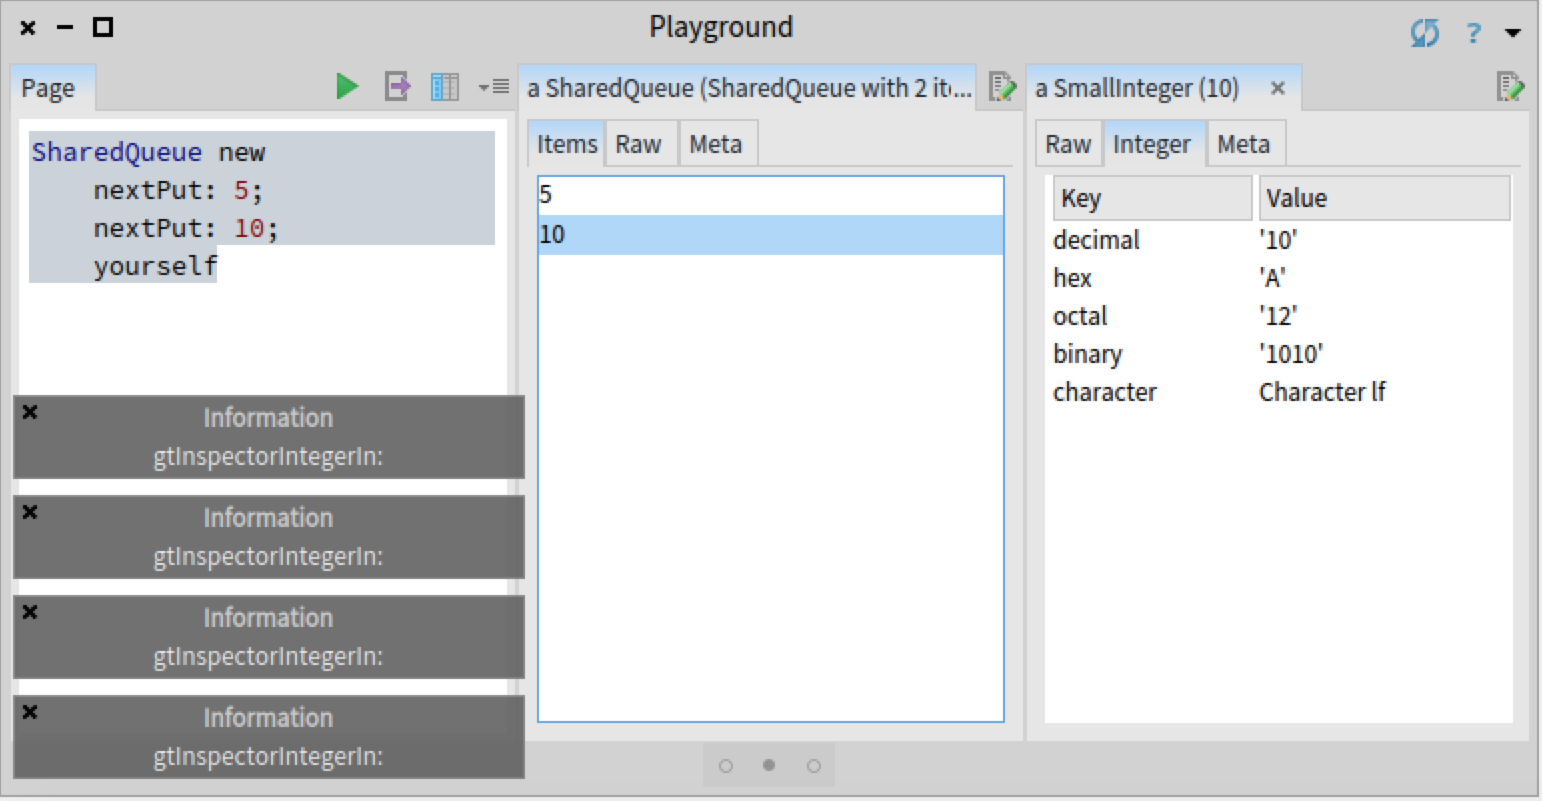
The bug in question only appers when the user selects an object within certain inspector views. For example, we reproduced the bug by creating and inspecting a SharedQueue object, and selecting any value in the 'Items' view. To get a visual indication of the bug, as the SharedQueue that we created contains integers, we added an #inform: message to the method Integer>>gtInspectorIntegerIn: creating the 'Integer' view. This way we can see that when selecting an object in the 'Items' view, the method is called four times:
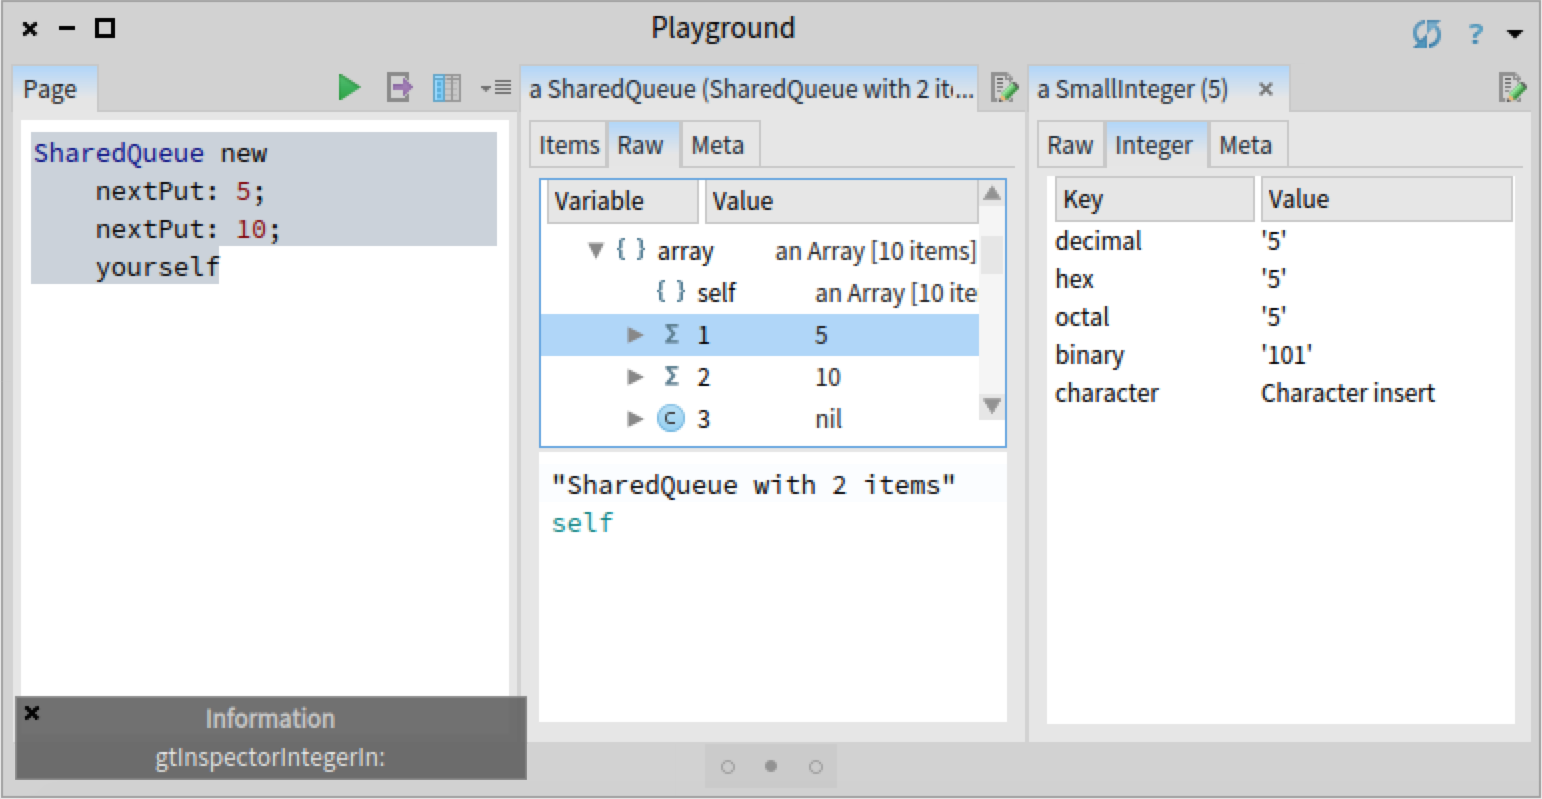
However, the bug did not appear when selecting an object in the 'Raw' view of a SharedQueue object:
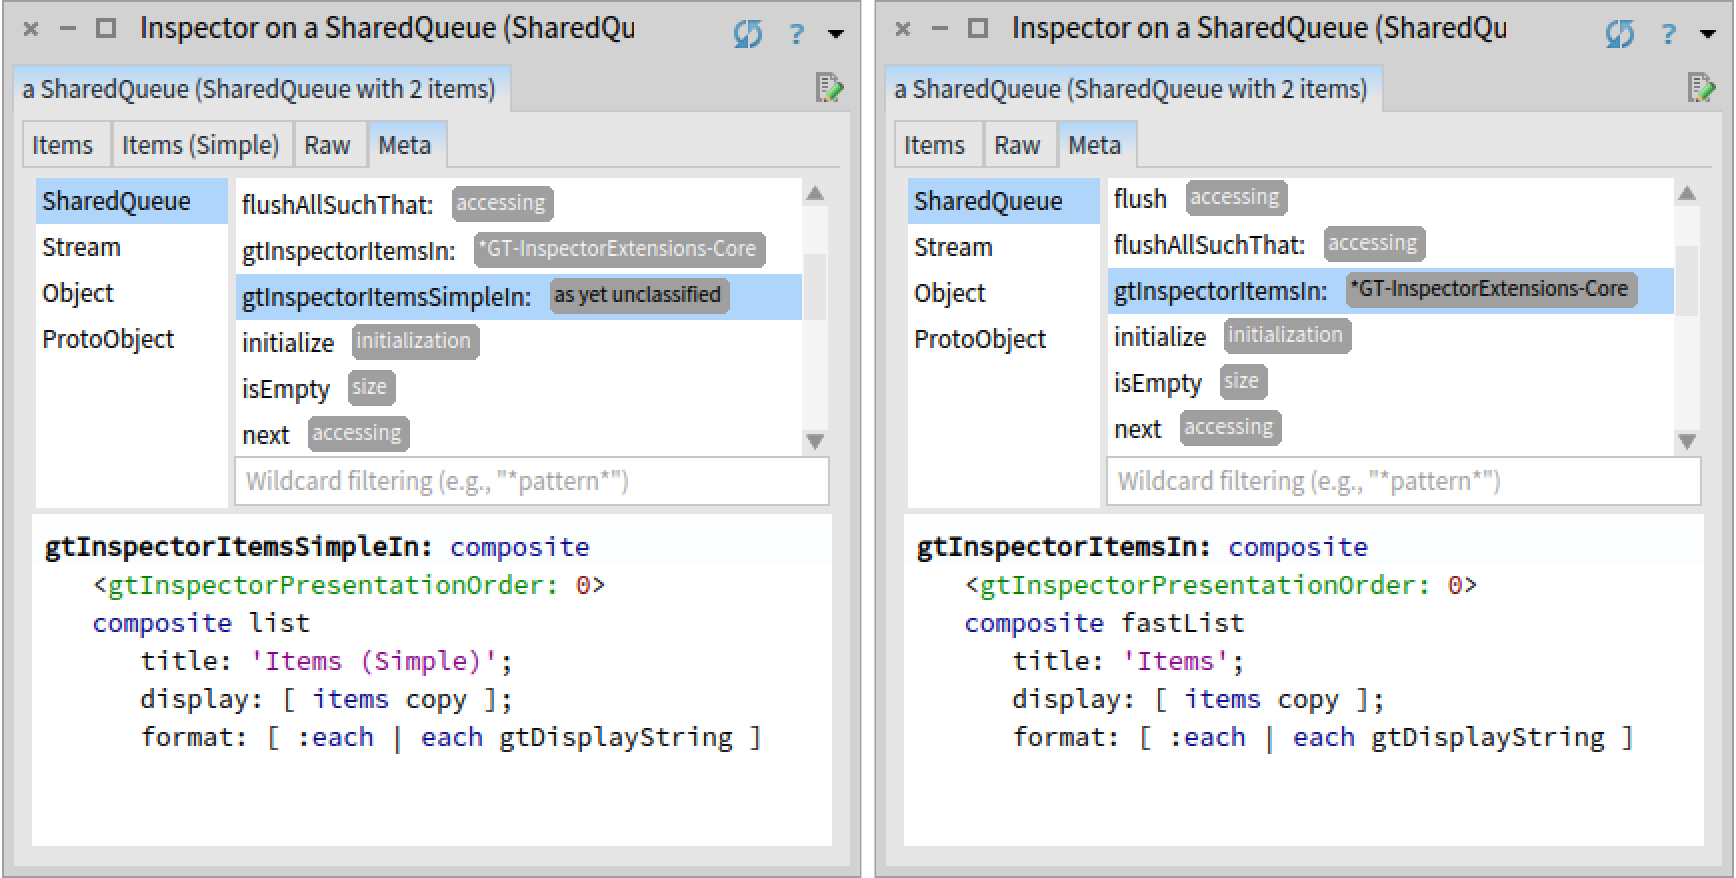
By looking at the code of SharedQueue>>#gtInspectorItemsIn:, we observe that it uses a Fast Table presentation. Given that the bug that we previously investigated was also related to Fast Table, we like to check first whether this bug is also related to Fast Table. One way to verify this hypothesis is to create an identical presentation for SharedQueue objects that does not use Fast Table to display a list, but the previous list renderer based on Pluggable Tree Morph. We can view the code of SharedQueue>>#gtInspectorItemsIn: and create the new view directly in the inspector:
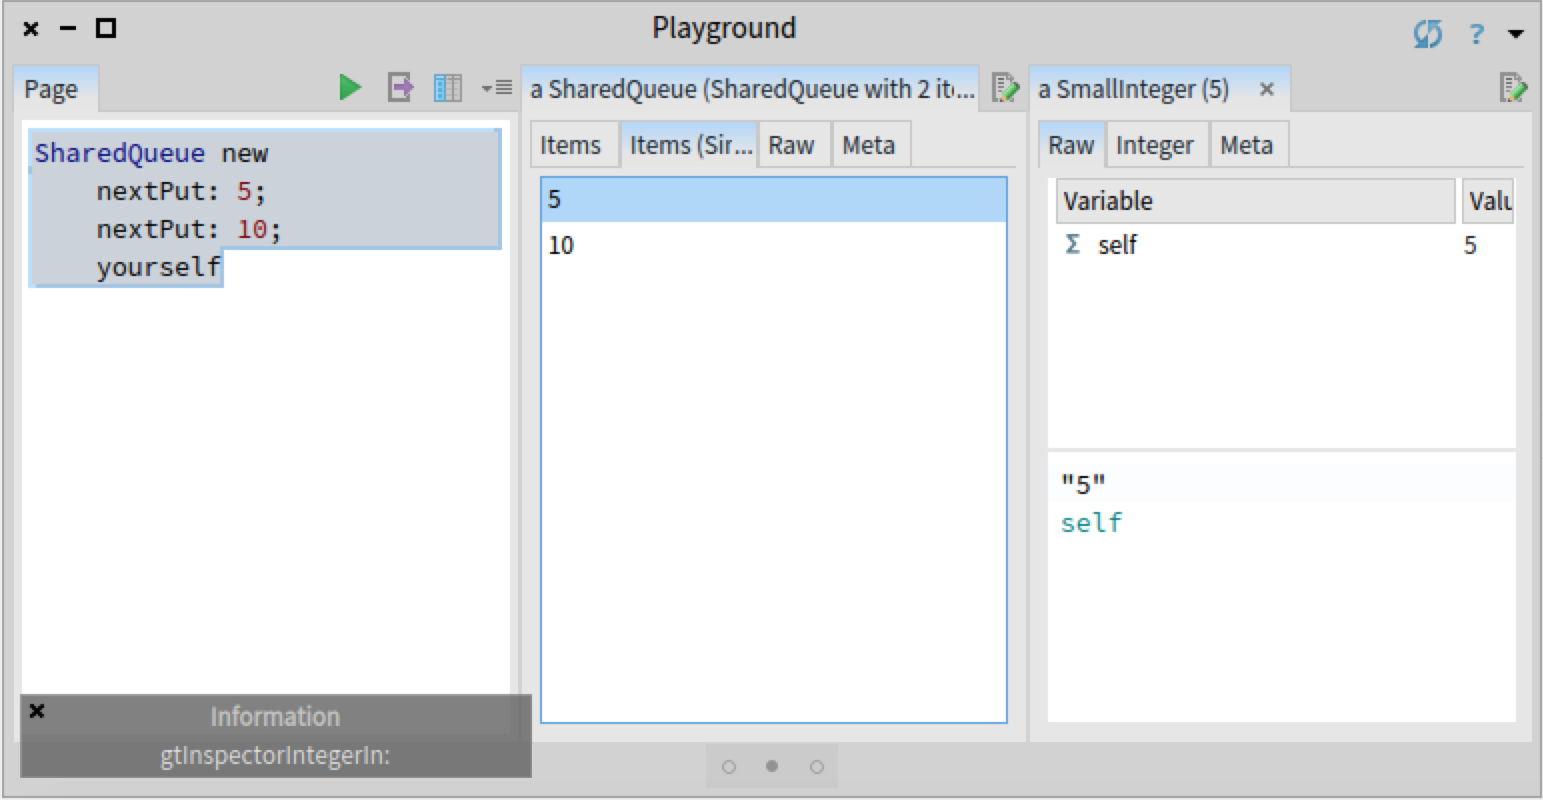
When redoing the previous scenario using the newly created view, we can indeed confirm that the bug is not present; Integer>>gtInspectorIntegerIn: is called only once. Hence, this bug is again related to Fast Table.
Comparing a buggy and a correct scenario
Given that we have a correct and a buggy scenario, before going any further, we would like to quickly check if there are any differences between an execution using Fast Table and an execution using Pluggable Tree Morph. We hypothesis that the problem could be caused by the Glamour renderer for Fast Table not following the same logic as Pluggable Tree Morph. Glamour, is the browsing engine on top of which GTInspector is implemented. Glamour provides two distinct renderers for displaying lists, one for Fast Table and one for Pluggable Tree Morph. If we do not see a divergence in the call stacks of the two renderers, we can focus our investigation on the Fast Table renderer.
We could approach this task by opening two debuggers and then manually scrolling through the stacks to find a difference. However, a less manual and error-prone approach consists in creating a custom view that shows the two call stacks using a tree, highlighting the points where the stacks diverge.
To build this tool we first need to log the two stack traces. For that we can rely on the Beacon logging engine and replace the #inform: call from the method Integer>>gtInspectorIntegerIn: with a logging statement that records the stack of method calls (MethodStackSignal emit).
Integer>>gtInspectorIntegerIn: composite
 <gtInspectorPresentationOrder: 30>

 MethodStackSignal emit.

  ^ composite table
    title: 'Integer';
    display: [ | associations | "..." ]
    "..."
We then start the recording using MemoryLogger start, and trigger the two scenarios by selecting an item in the views 'Items (simple)' and 'Items'. Next, we stop the recorder and inspect the collected stacks using the GTInspector:
MemoryLogger instance recordings collect: #stack
We observe that we got five stacks. Four correspond to the buggy scenario, and one to the correct scenario. We also notice that there is a difference in the number of stack frames between the two scenarios.
![]()
Nevertheless, if we briefly look at one correct and one buggy stack trace, we notice that there are a lot of frames that are not related to Glamour, caused by how the two graphical widgets (FTTableMorph used by the Fast Table renderer and PaginatedMorphTreeMorph used by the Pluggable Tree Morph renderer) handle the selection of an element. To verify our hypothesis, we are only interested in those stack frames related to Glamour.
To build the custom view, we switch to the 'Raw' view of the inspector and use a Roassal script. First, we select a correct and a buggy stack trace and then remove all stack frames that are not related to Glamour. We rely on the fact that all Glamour classes have the prefix 'GLM'. Then, we add the filtered stack frames in one set, draw edges between consecutive entries, and arrange the graph in a tree. We also attach an index to methods for ensuring that multiple occurrences of the same method in the stack will have different entries in our view.
| view stacks |
view := RTMondrian new.
stacks := ({self first. self second}) collect: [ :aStack |
  aStack select: [ :frame | frame methodClass name beginsWith: 'GLM' ] ].

stacks := stacks collect: [ :aStack |
  aStack withIndexCollect: [ :aFrame :index |
    index -> aFrame method ] ].

view shape label text: [:each | each value gtDisplayString truncate: 50 ] .
view nodes: (stacks flatCollectAsSet: #yourself).
stacks do: [ :aStack |
  aStack overlappingPairsDo: [ :a :b |
    view edges
      connectFrom: [:x | b ]
        to: [:x | a ] ] ].
view layout tree.
view.
Executing the script in place shows us the view in a new pane to the right directly in the inspector:
We immediately notice that most of the two stacks are identical, with some small differences at the top. We zoom in and slightly rearrange the top contexts to better understand what causes this difference:
In this case, we discover that the difference appears because the Glamour renderer for Fast Table and the Glamour renderer for Pluggable Tree Morph have a different way of propagating the selection. However, in the end, both renderers call the correct method GLMPresentation>>#selection:. Hence, the problem is most likely related to Fast Table. We use this newly gained insight to steer the focus of our investigation.
Comparing the four incorrect stack traces
Our next hypothesis is that in the four buggy stack traces the execution branches in a certain method because of a loop. Verifying this hypothesis requires a tree visualization that shows execution branches caused by the same method being sent to different objects. In the previous view, we only took into account methods. To build this new view, we also need to log the actual objects from the execution stack. We can do this be replacing the MethodStackSignal logger with ContextStackSignal logger in the method Integer>>gtInspectorIntegerIn::
Integer>>gtInspectorIntegerIn: composite
<gtInspectorPresentationOrder: 30>

ContextStackSignal emit.

^ composite table
  title: 'Integer';
  display: [ | associations | "..." ]
  "..."
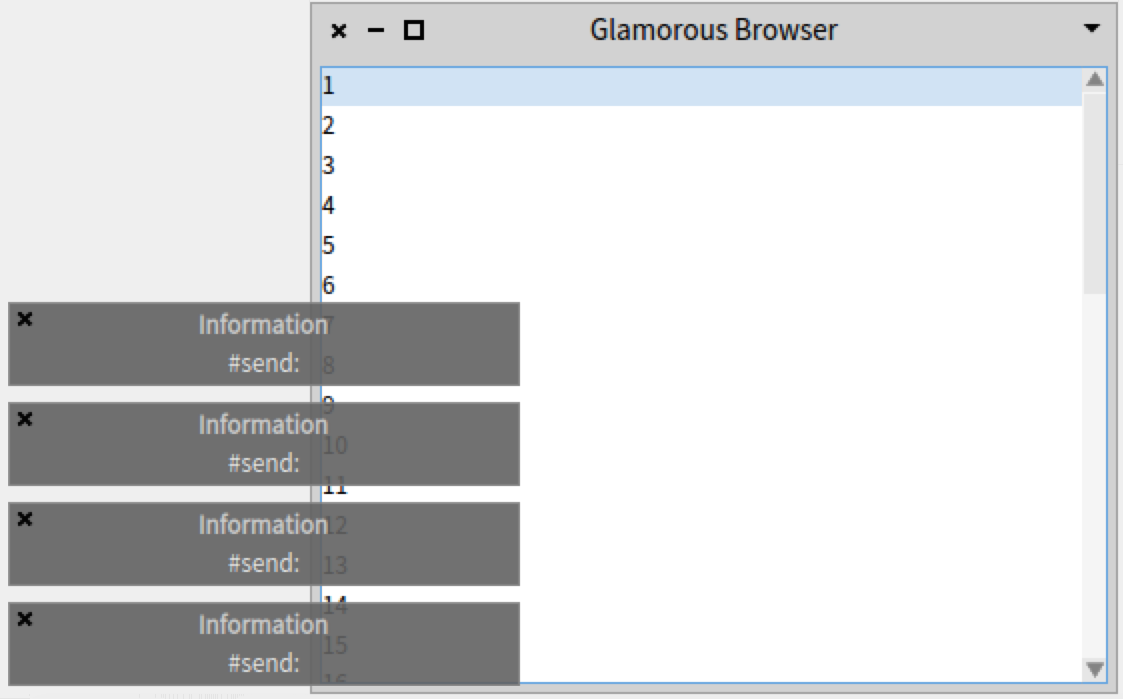
We then clear and start the MemoryLogger, and select an item in the buggy `Items` view. Inspecting the log shows the four stack traces:
![]()
We create next the tree vizualization using Roassal and execute it in place. We follow the same steps as for the previous visualization, this time without doing any filtering of the stack frames:

In the resulting view we can see that we have four stack traces because the execution branches in two places: an initial branch point that occurs only once, and a second one that occurs two times.
Next, we can zoom in and investigate each stack frame corresponding to a branch point in detail:
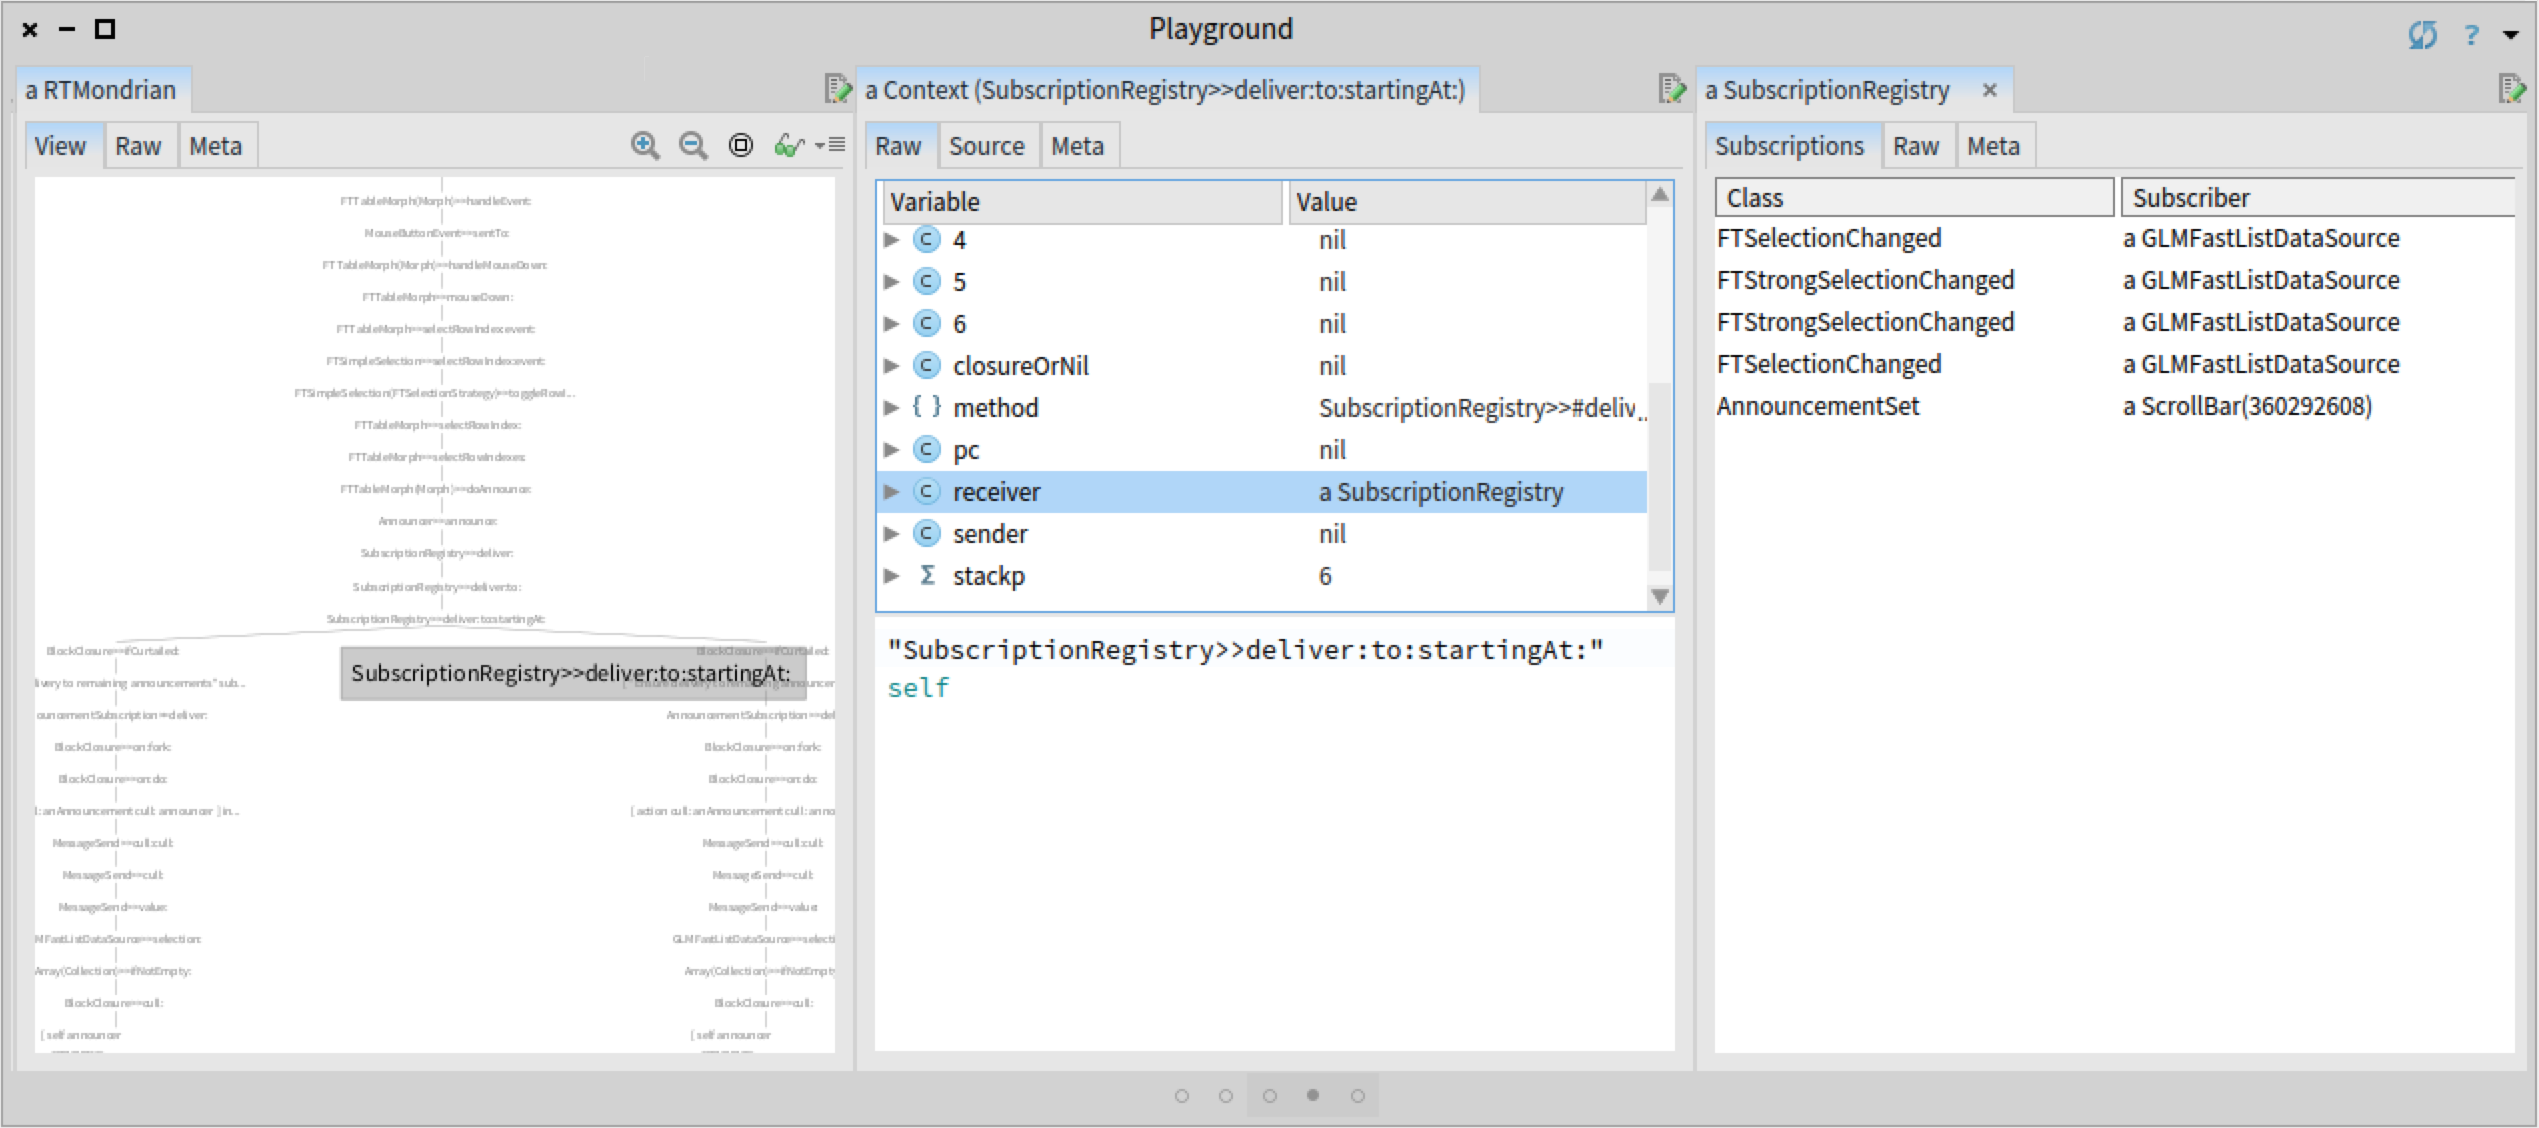

In each case we notice that the inspected announcer has some duplicated subscriptions. Having some knowledge of the Glamour renderer, we suspect that this should not be the case; each subscription should be registered only once. We use this insight to continue the investigation.
Reducing the scope
Now that we detected a possible cause for the bug, before going any further, we can devise a simpler example exhibiting the same behaviour:
GLMCompositePresentation new
  with: [ :c |
    c fastList
      send: [ :anInteger | self inform: '#send:'. anInteger ] ];
   openOn: (1 to: 42)
After executing the code above and selecting an element in the list, we get the same four notifications as before.
Finding the cause of the duplication
To verify if those announcements need to be registered twice, we need to find the places where the registration happens. Searching for the methods that reference the class FTSelectionChanged (one of the duplicated announcements) we discover that it is called from the method GLMMorphicFTRenderer>>initializeAnnouncementForDataSource. The fact that the subscription is registered twice indicates that the method is called twice. We proceed as before, and instead of putting a breakpoint in the method, we add a Beacon logging statement, and only record events while we open the buggy browser.
GLMMorphicFTRenderer>>initializeAnnouncementForDataSource
  ContextStackSignal emit.
  "..."
RecordingBeacon new
  runDuring: [
    GLMCompositePresentation new
      with: [ :c |
        c fastList
          send: [ :anInteger | self inform: '#send:'. anInteger ] ];
      openOn: (1 to: 42) ].
We see that indeed there are two calls to #initializeAnnouncementForDataSource. As the log event recorded the entire stack, we can select and explore the two contexts making the call to the method #initializeAnnouncementForDataSource that registers the FTSelectionChanged announcement:
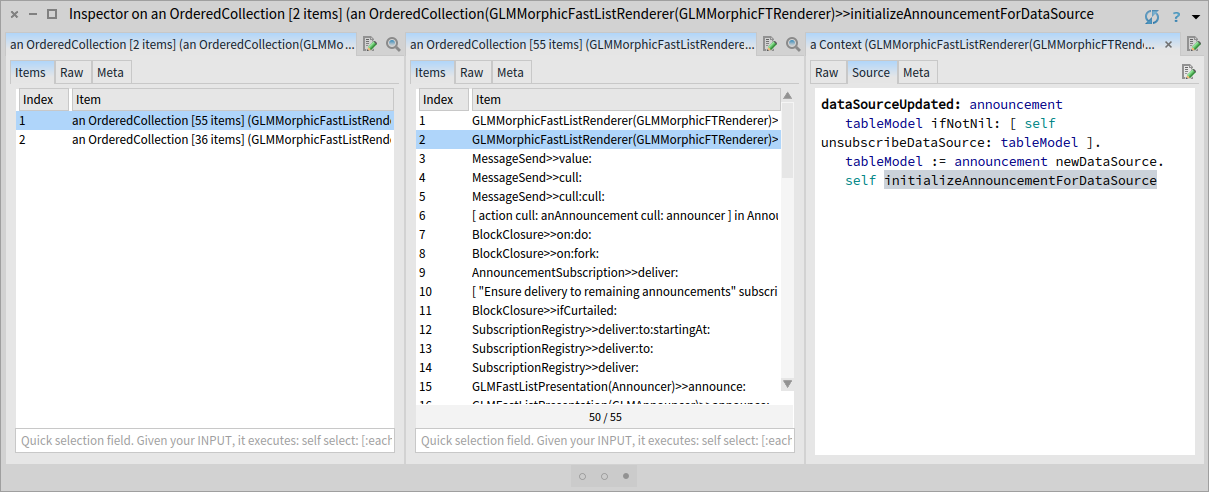

We observe that the first call is made from the method GLMMorphicFastListRenderer>>render:, and the second from the method GLMMorphicFastListRenderer>>dataSourceUpdated:. To understand the relation between these two methods within the execution, we again construct a tree with the two call stacks. We already have a visualization for this task, as we built it in a previous step.
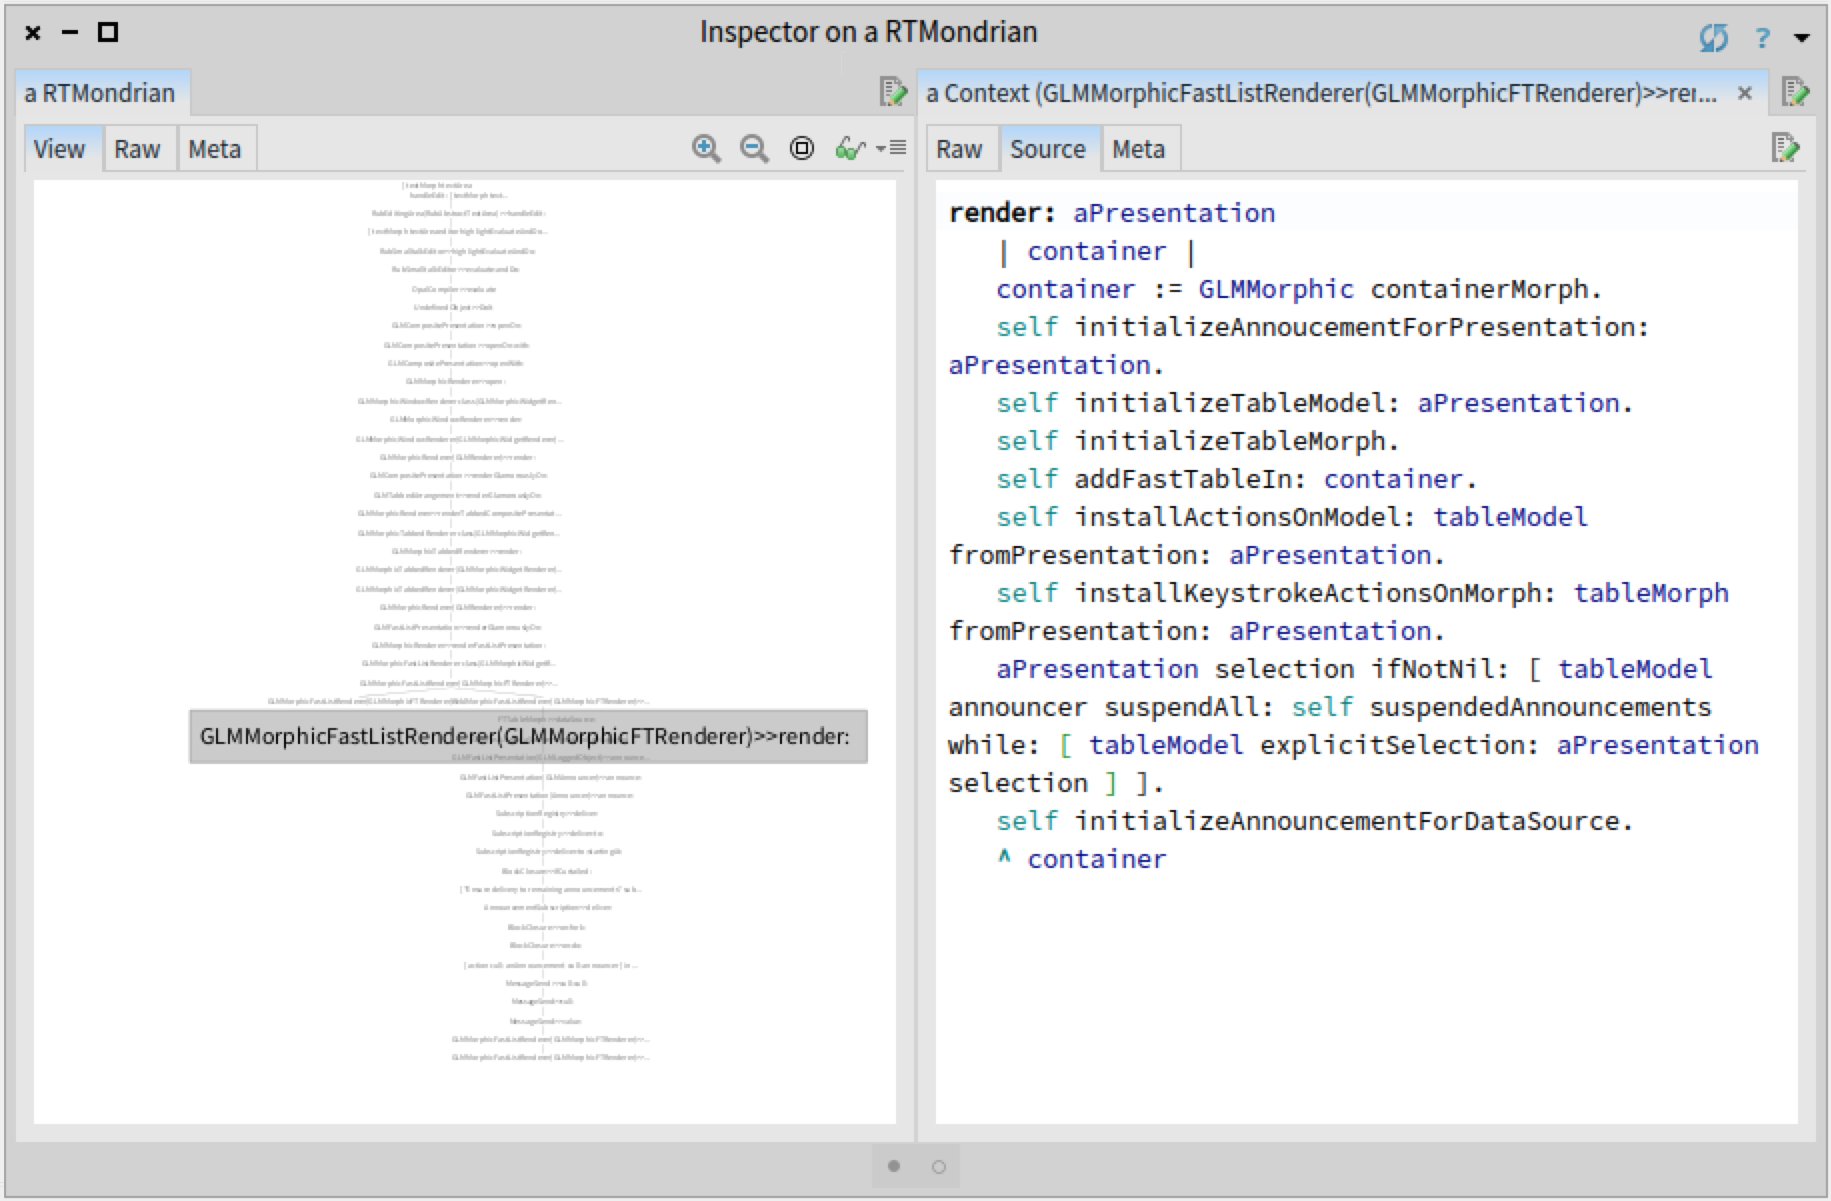
We immediately see that the two stacks diverge in the method GLMMorphicFastListRenderer>>render:. This is actually the method that makes the first call to #initializeAnnouncementForDataSource. We can now navigate through the other call stack to understand why it was made. We can basically use the GTInspector as a port-mortem debugger!


Before moving forward, we need to clarify a relevant aspect regarding the design of the Glamour renderer for Fast Table. GLMMorphicFastListRenderer is the Fast Table renderer. The renderer creates a graphical widget (FTTableMorph), a data source and links them together. The widget displays the elements visually and the data source provides the elements that will be displayed.
We see in the previous view that the second call to #initializeAnnouncementForDataSource happens when the graphical widget FTTableMorph is initialized. The reason is that whenever the data source is changed within a FTTableMorph widget, the method #initializeAnnouncementForDataSource is called to link the graphical widget with the new data source. We can see this in the method GLMMorphicFastListRenderer>>#dataSourceUpdated: that is called whenever the data source is changed in the widget, as a result of the GLMDataSourceUpdated announcement (GLMMorphicFastListRenderer>>readyToBeDisplayed):
dataSourceUpdated: announcement
  tableModel ifNotNil: [ self unsubscribeDataSource: tableModel ].
  tableModel := announcement newDataSource.
  self initializeAnnouncementForDataSource
If we look for methods referencing GLMDataSourceUpdated, we discover that the link between the announcement GLMDataSourceUpdated and the method #dataSourceUpdated: is created when the renderer (GLMMorphicFastListRenderer) is initialized:
initializeAnnoucementForPresentation: aPresentation
  aPresentation when: GLMDataSourceUpdated send: #dataSourceUpdated: to: self.
  aPresentation when: GLMContextChanged send: #actOnContextChanged: to: self.
  aPresentation when: GLMPresentationUpdated send: #actOnUpdatedPresentation: to: self
At this point we gained a good understanding of the factors causing the bug. To summarize them: when a Fast Table view is created, the method GLMMorphicFastListRenderer>>render: instantiates a new data source and calls #initializeTableMorph. #initializeTableMorph creates a graphical widget and sets its data source. After the graphical widget is initialized GLMMorphicFastListRenderer>>render: calls #initializeAnnouncementForDataSource to properly set the announcements between the graphical widget and the data source. However, this method was already executed when the data source was set in a FTTableMorph widget in #dataSourceUpdated:. Hence, we can fix the bug by removing the explicit call to #initializeAnnouncementForDataSource from GLMMorphicFastListRenderer>>render:.
Documenting our finding
Now that we found and fixed the bug we can document our finding. To ensure that this bug will not happen in the future, the best solution is to rely on a test. We create a test that verifies that there are no duplicated subscriptions in an announcer. We then apply this test on the two announcers from Glamour that have duplicated subscriptions. This way, if at any point in the future a duplicated subscription is introduced, we will be notified and can check if the duplication makes sense or if it is a bug.
testNoDuplicateRegistrationsInFastTableRenderer
  | table |
  window := GLMCompositePresentation new
    with: [ :c |
      c fastList ];
    openOn: (1 to: 42).

  table := self find: FTTableMorph in: window.
  self assertNoDuplicatedAnnoucementsIn: table announcer.
  self assertNoDuplicatedAnnoucementsIn: table dataSource announcer.
Building a toolset
Solving this bug was done through building custom tools. In this particular case, the tool consisted in a view for displaying stack traces using a tree. Initially, when we solved the previous bug related to Fast Table, we also built such a view, but then we did not know if we will even reuse that view (tool) so we threw it away. Now, we had to reuse the view again and make a few adaptations: filter stack frames using a condition and create edges based only on method calls. Hence, we can now spend 15 minutes more and transform this view into a tool that we can then reuse in the future, whenever we need to compare stack traces.
We transform this view into a tool by putting in into a dedicated class and adding an API for configuring it:
BeaconRTStackViews>>#executionTreeForContextSignals: aCollectionOfSignals
  | stacks |
  stacks := ((aCollectionOfSignals
    select: [ :each | each isKindOf: ContextStackSignal ])
    collect: #stack).
  ^ self executionTreeForContexts: stacks
      select: [ :each | true ]
      transform: [ :each | each ]
BeaconRTStackViews>>#executionTreeForContexts: aCollectionOfStacks select: aFilterBlock transform: aTransformBlock
| view stacks |
stacks := aCollectionOfStacks collect: [ :aStack | aStack select: aFilterBlock ].
stacks := stacks collect: [ :aStack |
aStack withIndexCollect: [ :aFrame :index | aTransformBlock cull: aFrame cull: index ] ].
view := RTMondrian new.
view shape label text: [:each | each value gtDisplayString truncate: 50 ] .
view nodes: (stacks flatCollectAsSet: #yourself).
stacks do: [ :aStack |
aStack overlappingPairsDo: [ :a :b |
view edges
connectFrom: [:x | b ]
to: [:x | a ] ] ].
view layout tree.
^ viewWe are still not done. We invested effort into building this tool, however, if other developers are not aware that this tool exists they will not use it. Hence, we should invest a few more minutes to address this.
This view is applicable when we inspect a collection of Beacon events of type ContextStackSignal. We extend the GTInspector with a custom action for collections that is only applicable if the collection contains at least one Beacon event of that type. We further implement the action so that the view is opened in a new pane to the right, preserving thus the workflow in the same inspector window.
SequenceableCollection>>#gtInspectorActionExecutionTree
  <gtInspectorAction>
  ^ GLMGenericAction new
    title: 'View contexts execution tree';
    category: 'Beacon';
    action: [ :aPresentation |
      aPresentation selection:
        (BeaconRTStackViews new executionTreeForContextSignals: self) ];
    condition: [ self anySatisfy: [ :each |
      each isKindOf: ContextStackSignal ] ]
Now, whenever somebody inspects a collection containing stack traces recorded with Beacon, she will be able to discover and open this view directly from the inspector:
![]()
Remarks
We started this session with the goal of understanding the cause of a bug and end it by adding a custom tool to our environment. We achieved this as we were able to rapidly create the necessary tool and easily incorporate it into the IDE. We could do this as Pharo is a moldable IDE where creating a new custom extension is just as easy as creating a test.