Assessing Pharo performance with the GTInspector
MessageTally is one of the mechanisms for checking the performance of Pharo code. In essence, it spawns a parallel process that observes the measured process. At specified intervals, the stack of the measured process is introspected and the execution counts (tally) of the methods found on the stack is increased accordingly. You can find more details about the inner workings of MessageTally you can consult both the MessageTally class comment and the profiling chapter from the Deep into Pharo book.
Let’s take a look at an example. To trigger it, you can simply wrap the desired functionality in a block and pass it to the MessageTally. For example, to profile the spawning of a System Nesting Map you can do this in a Moose image:
MessageTally spyOn: [
     MooseModel root allModels last allClasses viewSystemNestingMap ].
This mechanism provides a nice example of what a truly reflective system allows for. In fact, the whole class contains some 600 lines of code, most of which is actually allocated to reporting. However, to make the most of data, you also need an appropriate presentation. Even if MessageTally is powerful in its simplicity, the solution falls short at the presentation level.
For example, executing the script above spawns a window with a textual summary of the execution:
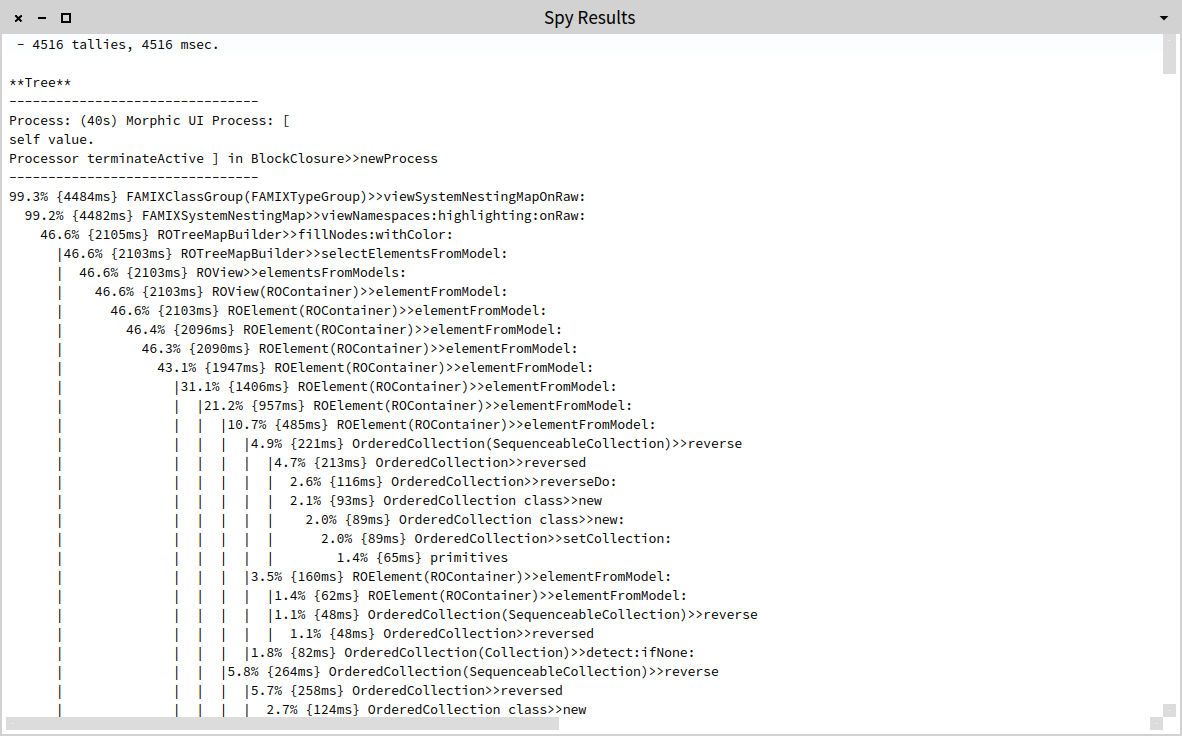
This is a rather primitive display that does provide all data, but it is poor at providing insights into the actual performance problem. There exists also a more interactive interface that provides a preview of source code for each method, but it is still rather limited in the amount of analysis one can do.
Let us look at the problem from the point of view of what we need. To find the root of a problem in an execution tree, you need to typically look for methods that take long, and whose children take less long.
To address this problem, the GTInspector offers a set of dedicated presentations. Let’s look at our example again. To open the GTInspector, we need to obtain the MessageTally instance, so currently the code looks slightly different:
MessageTally new
spyEvery: 1
on: [ MooseModel root allModels last allClasses viewSystemNestingMap ];
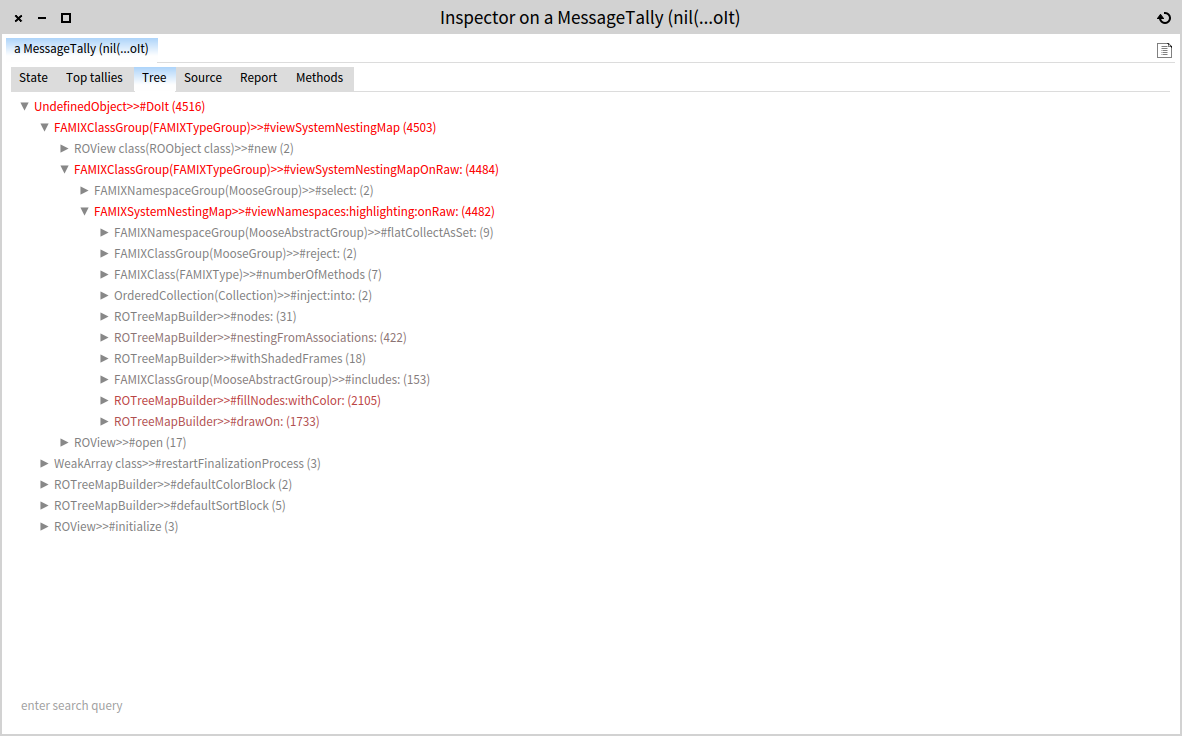
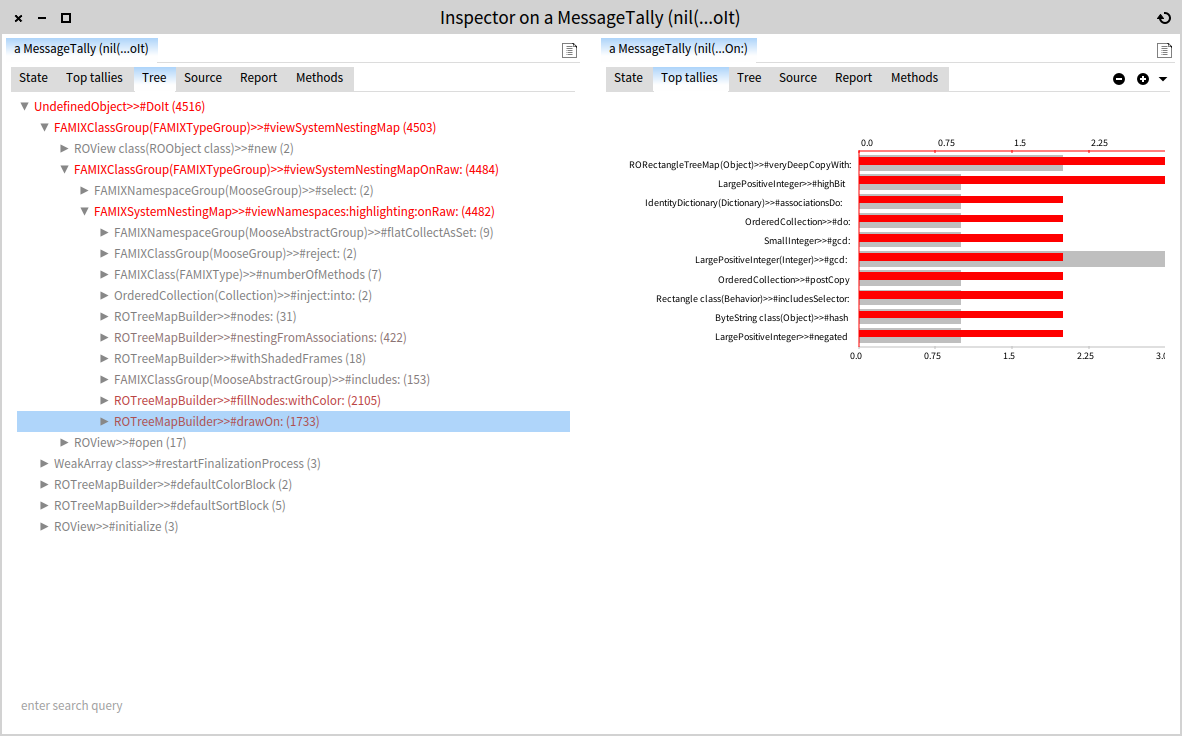
yourself One of the presentations offers the execution tree. In this presentation, the labels are colored based on a linearization from red (maximum tallies) to gray (minimum tallies). In other words, red takes a long time, and gray is fast. This simple coloring can immediately guide our search: we drill down until there is a significant color change between the parent and the children nodes.
In our case, we see that the real problem starts in FAMIXSystemNestingMap>>#viewNamespaces:highlighting:onRaw:. Looking closer we notice that the problem seems to be related to two distinct methods from ROTreeMapBuilder: fillNodes:withColor and drawOn:. Indeed, as the treemap is a rather expensive algorithm, it is expected that the actual drawing computation to be not cheap. But, why should the filling of nodes be expensive?
At this point, we need more information. First, we need to look at the source. Selecting the node spawns the associated MessageTally object to the right. Selecting the dedicated presentation, we can preview the associated source code.
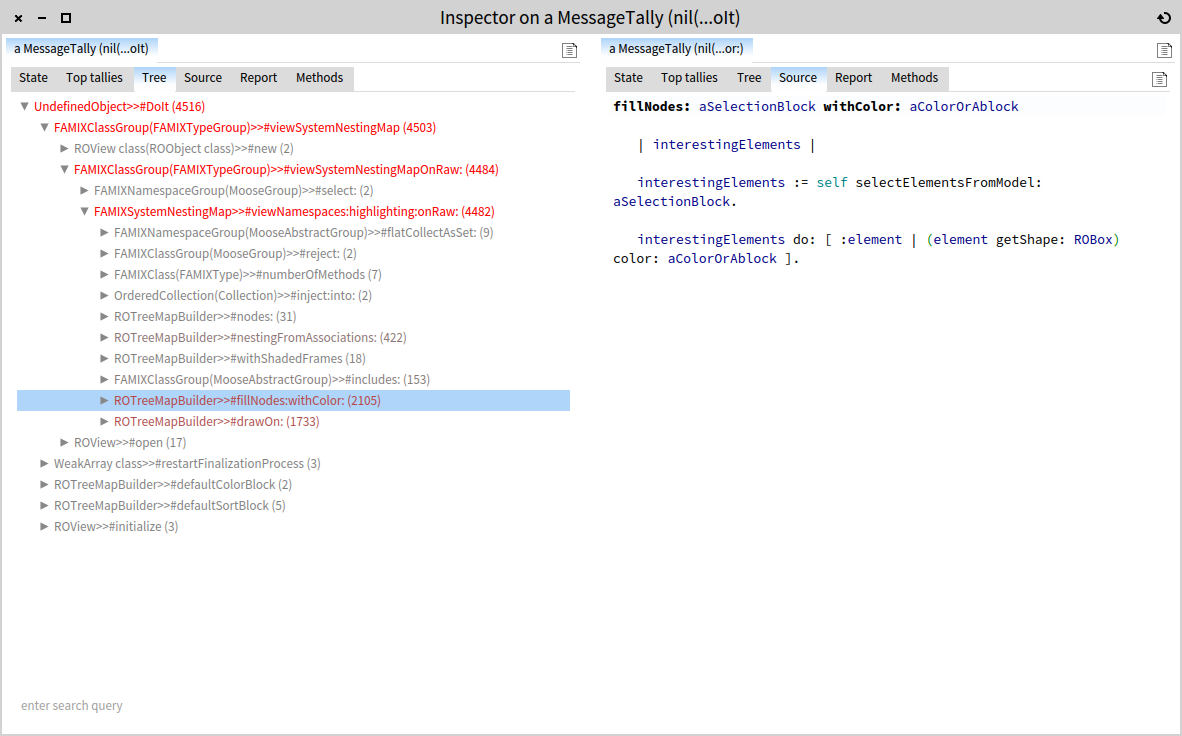
It looks like a simple method. What can be expensive here? We need to focus on this part of tree and dig deeper. To do this, we can select on the right the tree presentation and this will give us the subtree of the overall execution. The benefit of doing that is that red is now recalibrated and allows us to spot differences better then when navigating on the left.
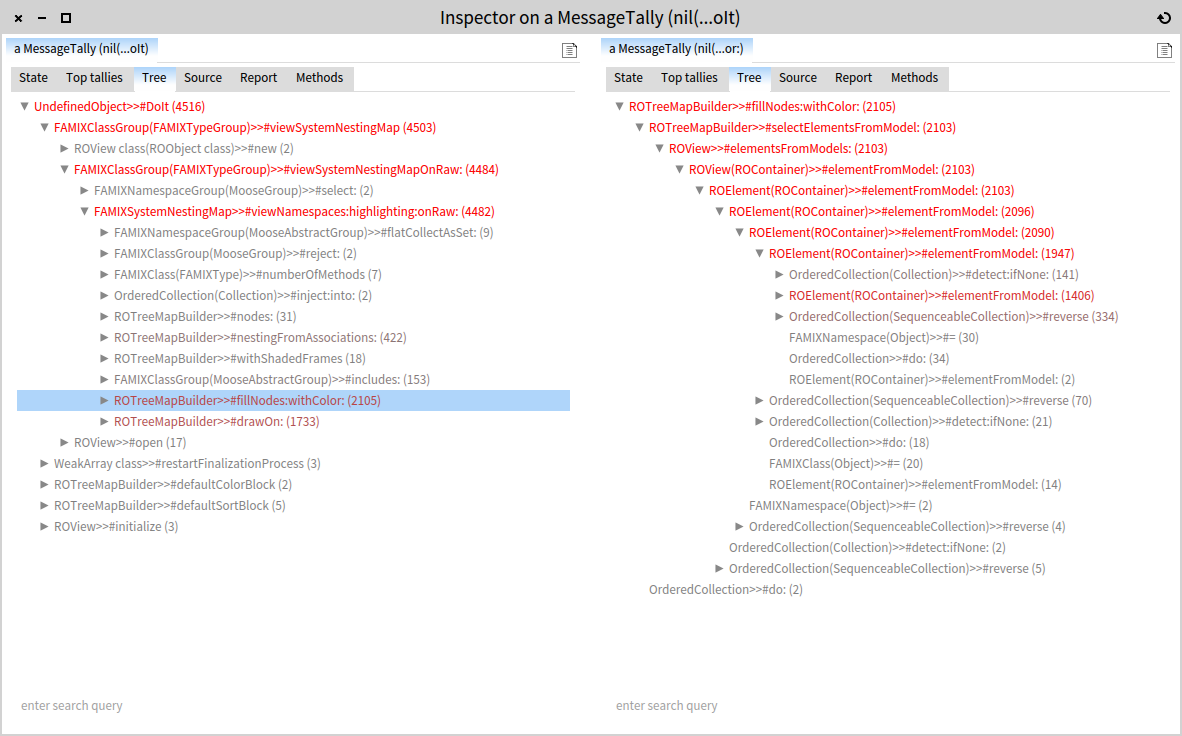
Digging through the subtree, we notice that the problem seems to be related to a recursive method: #elementFromModel:. To check the source code, we can simply select it and preview it on the right.
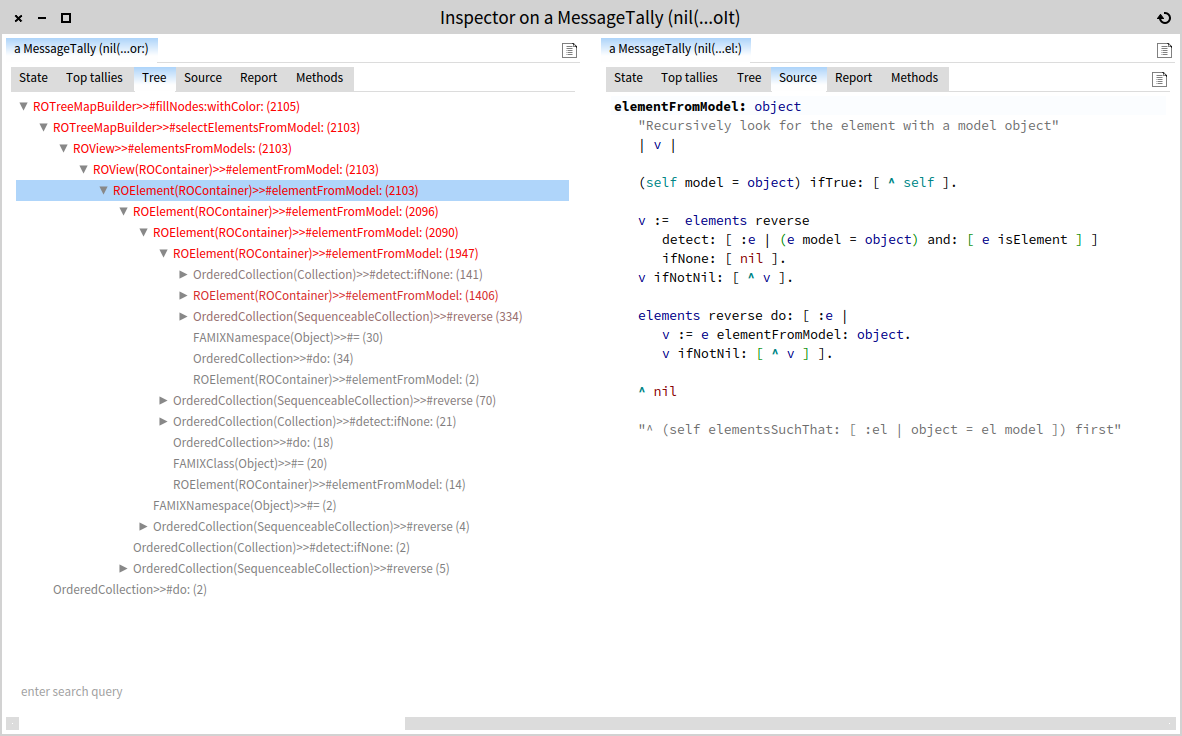
Indeed, the method is traversing the Roassal elements to find the element with the desired model behind. Continuing the assessment we can conclude that we need a different solution that does not rely on looking up nodes for specifying the corresponding fill color. Instead, we should have a solution that specifies the color at the node creation time. But, this is for another time.
The important thing is that we had a real scenario and the actual assessment took minutes even though it went well beyond a shallow measurement. Appropriate presentation and interaction can provide a significant boost when working with data.
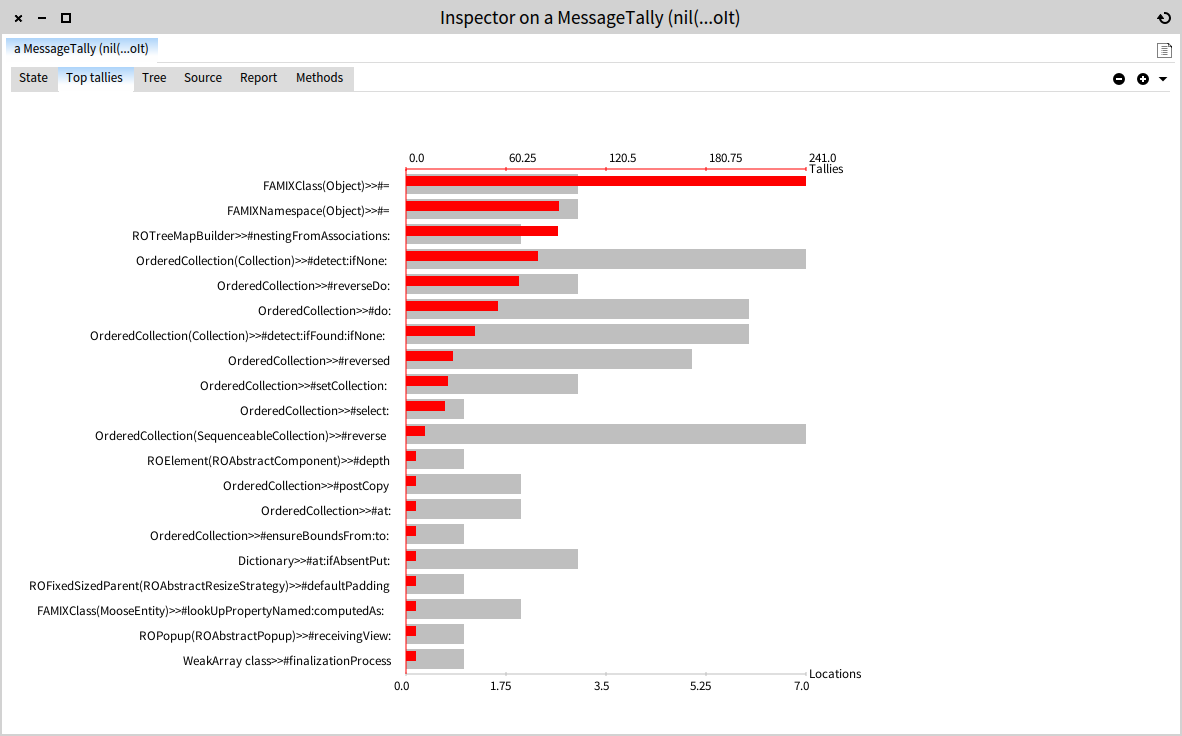
But, that is not even all when it comes to MessageTally. Another piece of information offered by the MessageTally is a list of the top most expensive leaf methods. Also in this case, you can benefit from a more appropriate presentation: a bar chart. The bar chart below makes use of the Graph-ET engine to show the top methods that take long (red shows the amount of tallies for each method, and gray shows the amount of locations in the execution tree).
In our case, the top most used method is equality for a FAMIXClass. Indeed, the nodes we want to color are are instances of FAMIXClasses, and this method to come on top because it is used for the comparison during the lookup logic.
Of course, as the chart is applicable to any MessageTally object, you can also combine it with a subtree selection. For example, to learn about what consumes the drawing of the treemap, we can simply select the drawOn: and preview the top tallies only for the subtree.
These are not complicated presentations (ok, perhaps the chart is less straightforward), but their combination together with the GTInspector workflow offers a powerful interface for a rather common problem. And the implementation costs 103 lines of code.